S&P: Bearish Scenario: Macro Update Part I

  • CastAwayTrader
  • October 1, 2023
<<< Back to All Updates
<<< Macro Updates

$SPX #S&P #Macro Update #Elliott Wave

Let’s update our two alternative macro scenarios. We will be looking at S&P 500 cash index.

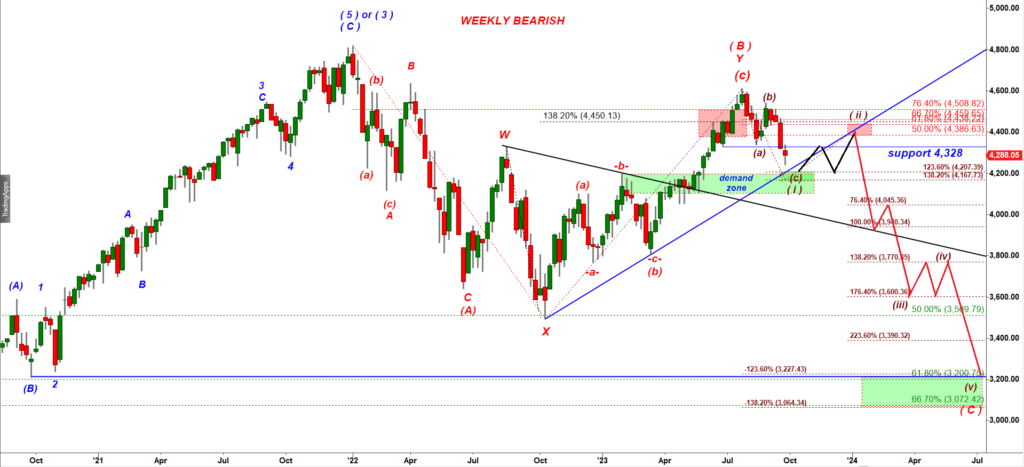
( I ) The Bearish Macro Scenario:

S&P 500 Weekly chart

Several important things you should take away from this chart:

(i) This scenario is based on assumption that off the Jan’22 top we should get a large corrective (A) down, (B) up, (C) down structure.

The corrective wave (B) topped in July 2023.

Off the July’23 top we should get a strong five wave down move in a wave (C) down.

(2) The key Support and the magnet for the second leg down is the key low made by the wave (B) down that bottomed at 3,209 on Sep 25, 2020.

See the thick blue line that coincides with a negative -123.6% ext of the wave (B) up tha topped in July 2023.

Memorize one very important and unknown rule:

“always consider tops and bottoms of previously completed subwaves “b” as important support and resistance levels“.

Check this out:

S&P 500 Weekly chart

Note how well price normally respects the previous highs and lows made by waves b up and down on any degree (of any size).

(3) S&P has approached the green demand zone.

Even under that Macro Bearish scenario the huge decline in the wave (C) down should start from the first small (a)-(b)-(c) move down off the low that normally is followed by a deep (a)-(b)-(c) up pullback making a lower high.

This is a textbook (i) up, (ii) down setup, a starting point of any large decline.

Big moves down always start from a small a-b-c move followed by a pullback making a lower high.

Price first crawls, then walks and finally runs.

Look how a strong move down started in 2008:

And there is a perfect reason explaining that phenomenon.

Price does not move it is moved. Price is moved by people and more specifically price is moved by people emotions and beliefs. The first a-b-c move down is moved by a small group of aggressive traders. When the first a-b-c move bottoms 90% of traders still believe that the a-b-c move down off the top is just a corrective pullback to be followed by another rally, its just a great long opportunity.

The crowd starts getting doubts about continuation of a rally after the first a-b-c move down is followed by a weak rally that fails to make a higher high. That lower high is what makes first cracks in conviction of the bullish crowd. This is when more traders join the bearish camp. The more traders join the bearish camp the stronger gets the next leg down.

You can read more about dynamics of changing prevailing sentiment of the crowd in my blog post

Let’s come back to the bearish scenario. Let’s zoom in to a 120 min chart of S&P:
S&P 500, 120 min chart

Note two blue lines. They mark the top of the wave -b- up (4,195.44) and the bottom of wave (b) down (3,808.86). Those are the key milestones. They will work simultaneously as targets and strong support levels.

Why? Because tops and bottoms of previously completed waves B or subwave “b” almost always work as important support and resistance levels.

So you can see S&P has not tagged that green demand zone that starts slightly under 4,200.

You can also see that S&P started a corrective wave -iv- up in the second part of the last week that may take a couple of more days before the final wave -v- down towards the green demand zone begins…

Just to remind you that I posted a bullish setup at the close of Friday.

That ES-mini chart shows a potential path for completion of that corrective wave -iv- up early this coming week…

Part II explaining the Bullish Macro scenario will follow next…

Subscribe to Free Updates

Get Unlimited Access

PrevPrevious$ES: Dropped As Expected: Bulls Can Attack 4,400 Resistance Next Week
Next$S&P: Bulls Consider the Pullback off the July High as a Buy Opportunity: Macro Update: Part IINext

More To Explore

$NQ: Bulls Got a Setup for a Rally

$NQ #NQ-mini #closing week Yesterday we correctly predicted NQ to plunge: NQ-mini 30 min chart posted on Thursday, May 23,

CastAwayTrader May 23, 2025

$ES: Where Bulls Will Feel Brave Again?

#ES #Elliott Wave #trading signals Yesterday I concluded my afternoon update with bearish prediction: “Bulls produced an overlapping textbook corrective

CastAwayTrader May 23, 2025

Important Disclaimer

CastAway Trader LLC, the publisher of this web-site and videos is not registered as an investment adviser nor a broker/dealer with either the U. S. Securities & Exchange Commission or any state securities regulatory authority. Users of the website www.castawaytrader.com and viewers of the videos are advised that all information presented on the website is solely for informational purposes, is not intended to be used as a personalized investment recommendation, and is not attuned to any specific portfolio or to any user’s particular investment needs or objectives.

Trading stocks, options, or futures carries a high level of risk, and may not be suitable for all investors. Before deciding to trade, you should carefully consider your objectives, financial situation, needs and level of experience. CastAway Trader LLC provides general overview of trading methods that does not take into account your objectives, financial situation or needs. The content of this website must not be construed as personal advice. All trading setups and/or trades presented in the web site and/or trading chat room by CastAway Trader an/or by other members of the chat should be considered hypothetical for educational purposes only and should not be expected to be replicated in a live trading account.

An investor could potentially lose all or more than the initial investment. You should not speculate with capital that you cannot afford to lose. Only risk capital should be used for trading and only those with sufficient risk capital should consider trading. Risk capital is money that can be lost without jeopardizing ones’ financial security or life style.

You should be aware of all the risks associated with trading. You should seek advice from an independent financial advisor.

Any information posted on this web site is not to be construed as an offer to sell or the solicitation of an offer to buy, nor is it to be construed as a recommendation to buy, hold or sell (short or otherwise) any security. All users of the website must determine for themselves what specific investments to make or not make and are urged to consult with their own independent financial advisors with respect to any investment decision. The reader bears responsibility for his/her own investment research and decisions, should seek the advice of a qualified securities professional before making any investment, and investigate and fully understand any and all risks before investing. All opinions, analyses and information posted on the website are based on sources believed to be reliable and written in good faith, but should be independently verified, and no representation or warranty of any kind, express or implied, is made, including but not limited to any representation or warranty concerning accuracy, completeness, correctness, timeliness or appropriateness. In addition, CastAwayTrader LLC and its officers and employees undertake no responsibility to notify such opinions, analyses or information or to keep such opinions, analyses or information current. Also be aware that the owners, officers and employees of the web site www.castawaytrader.com may have long or short positions in securities that may be discussed on the website, Premium Trading Chat room and/or in the videos posted by CastAway Trader LLC.

Past results are not indicative of future profits.

Subscribe to Free Updates

Get Unlimited Access