Skip to content
  • Home
  • US Market Updates
  • Indicators
    • Impulse Master
    • Cycle Trader
    • GANN Levels
    • Subscribe
  • Education
    • Beginners Video Course
    • Intermediate Video Course
      • Syllabus of the Course
    • Trading Like A Pro Video Course
    • Video Lesson of the Week
  • Chat Room
  • Pricing
  • FAQ
  • My Account
  • Login

NQ - has the most bearish look

In my last update posted on 9 Feb 2019 I wrote:

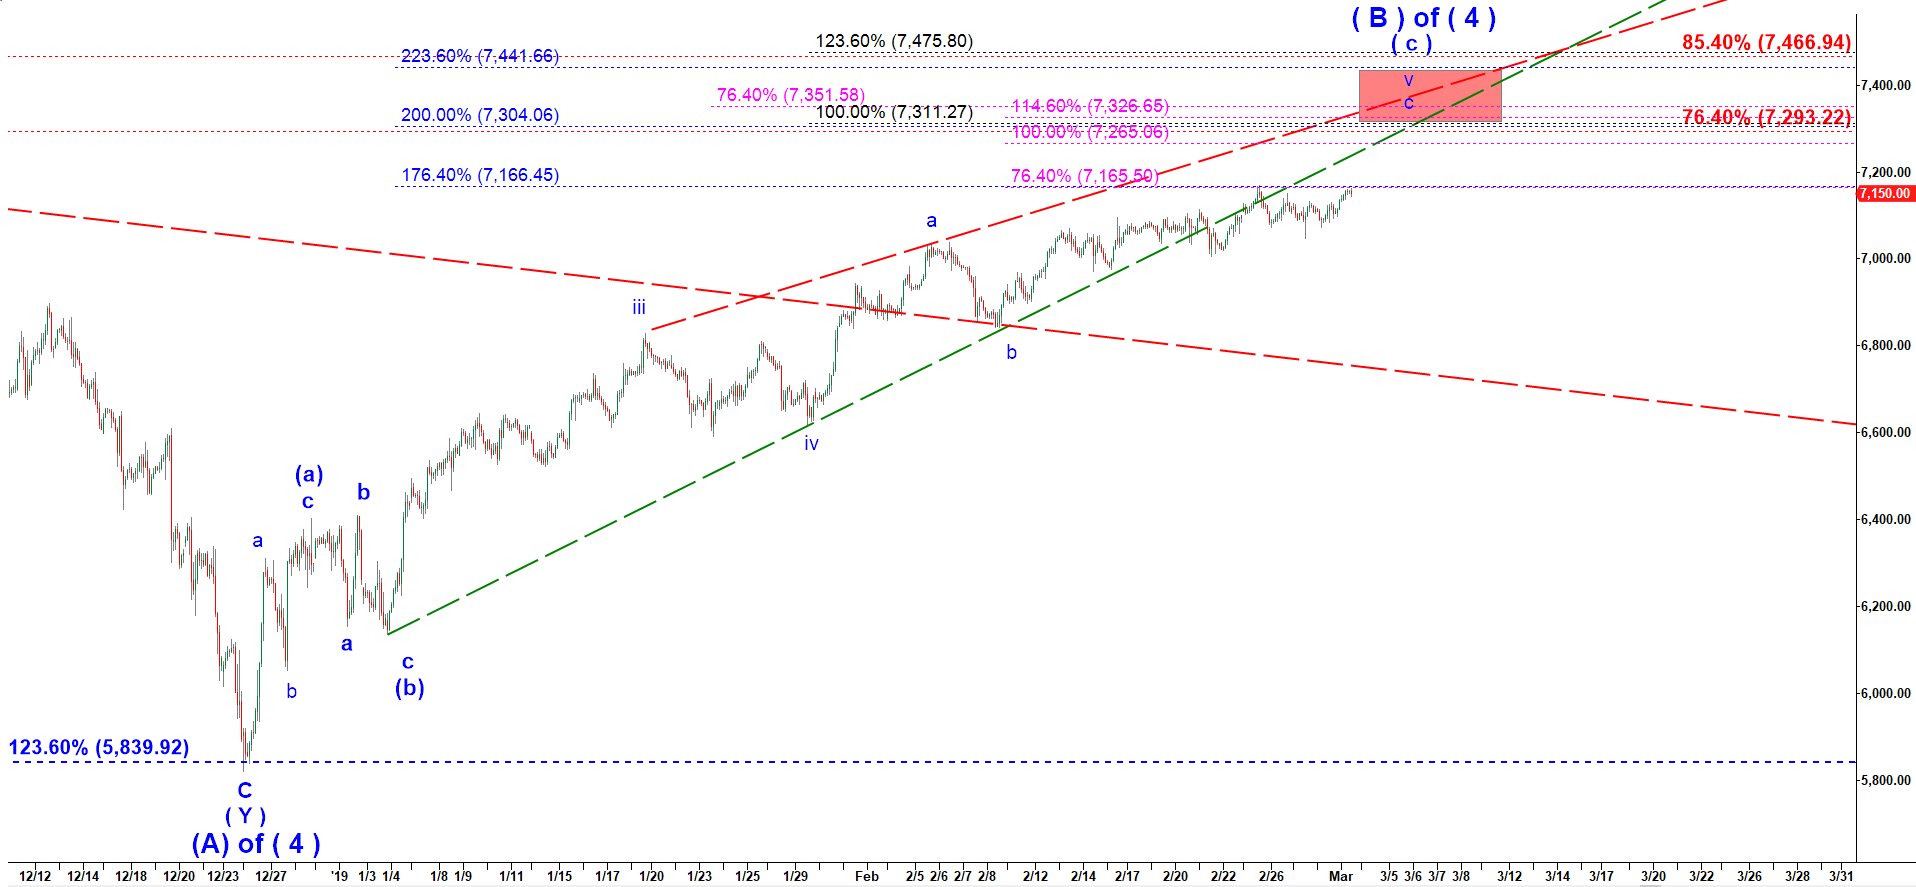
“I know the pullback last week was a sweet long expected treat for bears. I know there are handful of arguments in favor of breakdown. But so far the support has held. Moreover, structure wise I can argue it needs another move up to a higher high. As long as it stays inside that contracting rising wedge it may grind higher at least to 7,170 but may extend to 7,300.”

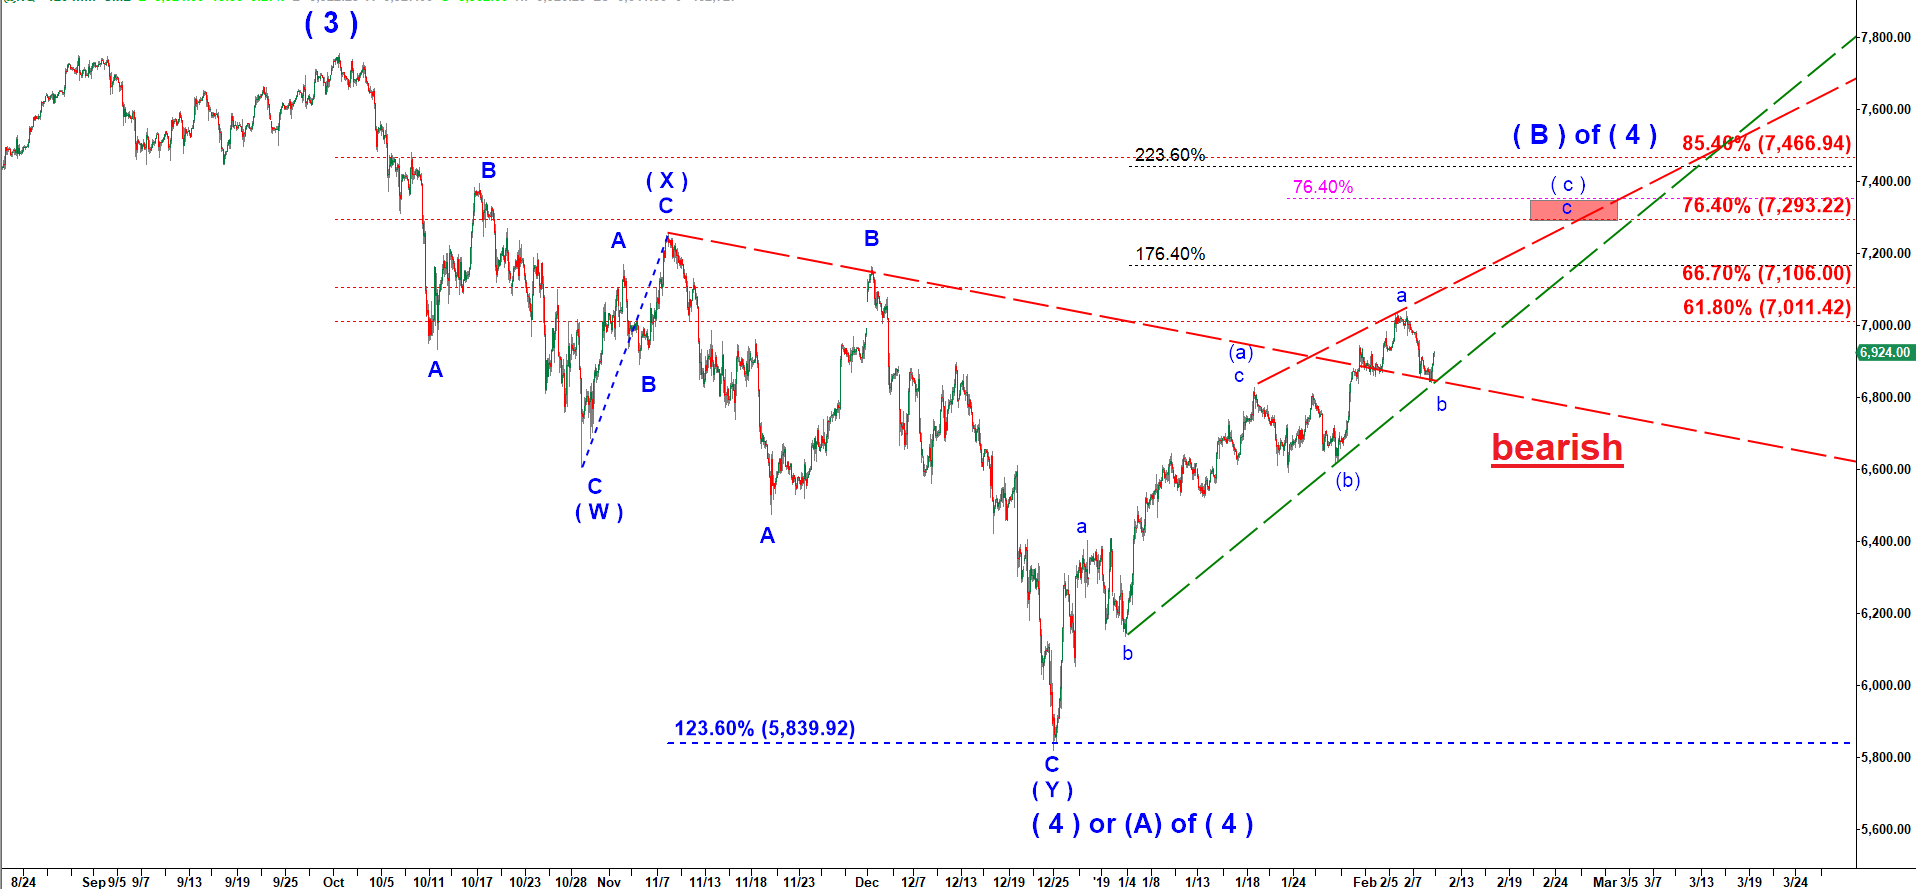
Look below at the chart I posted three weeks ago.

NQ - 120 min chart updated on 9 February 2019

I still see the area of 7,300-7,311-7,326 as the main destination of this rally. And the structure off the whole move up off December 2018 looks crappy. If in SPY and RTY I can get signs of a five wave up structure I can’t get anything impulsive from this structure. So far this rally looks corrective and hints for a strong decline after it finally tops out.

NQ - 120 min chart updated on 1 March 2019

Start to learn how to predict the next market move today!
Check out my latest updates

Read my Blog

© 2025 CastAway Trader • Built with GeneratePress