Skip to content
  • Home
  • US Market Updates
  • Indicators
    • Impulse Master
    • Cycle Trader
    • GANN Levels
    • Subscribe
  • Education
    • Beginners Video Course
    • Intermediate Video Course
      • Syllabus of the Course
    • Trading Like A Pro Video Course
    • Video Lesson of the Week
  • Chat Room
  • Pricing
  • FAQ
  • My Account
  • Login

TVIX - looks having bottomed in the green target box

Yesterday at open I wrote:

“…this gap down may very well be the final exhaustion gap finalizing the whole downside structure off the top made by volatility in late December 2018.”

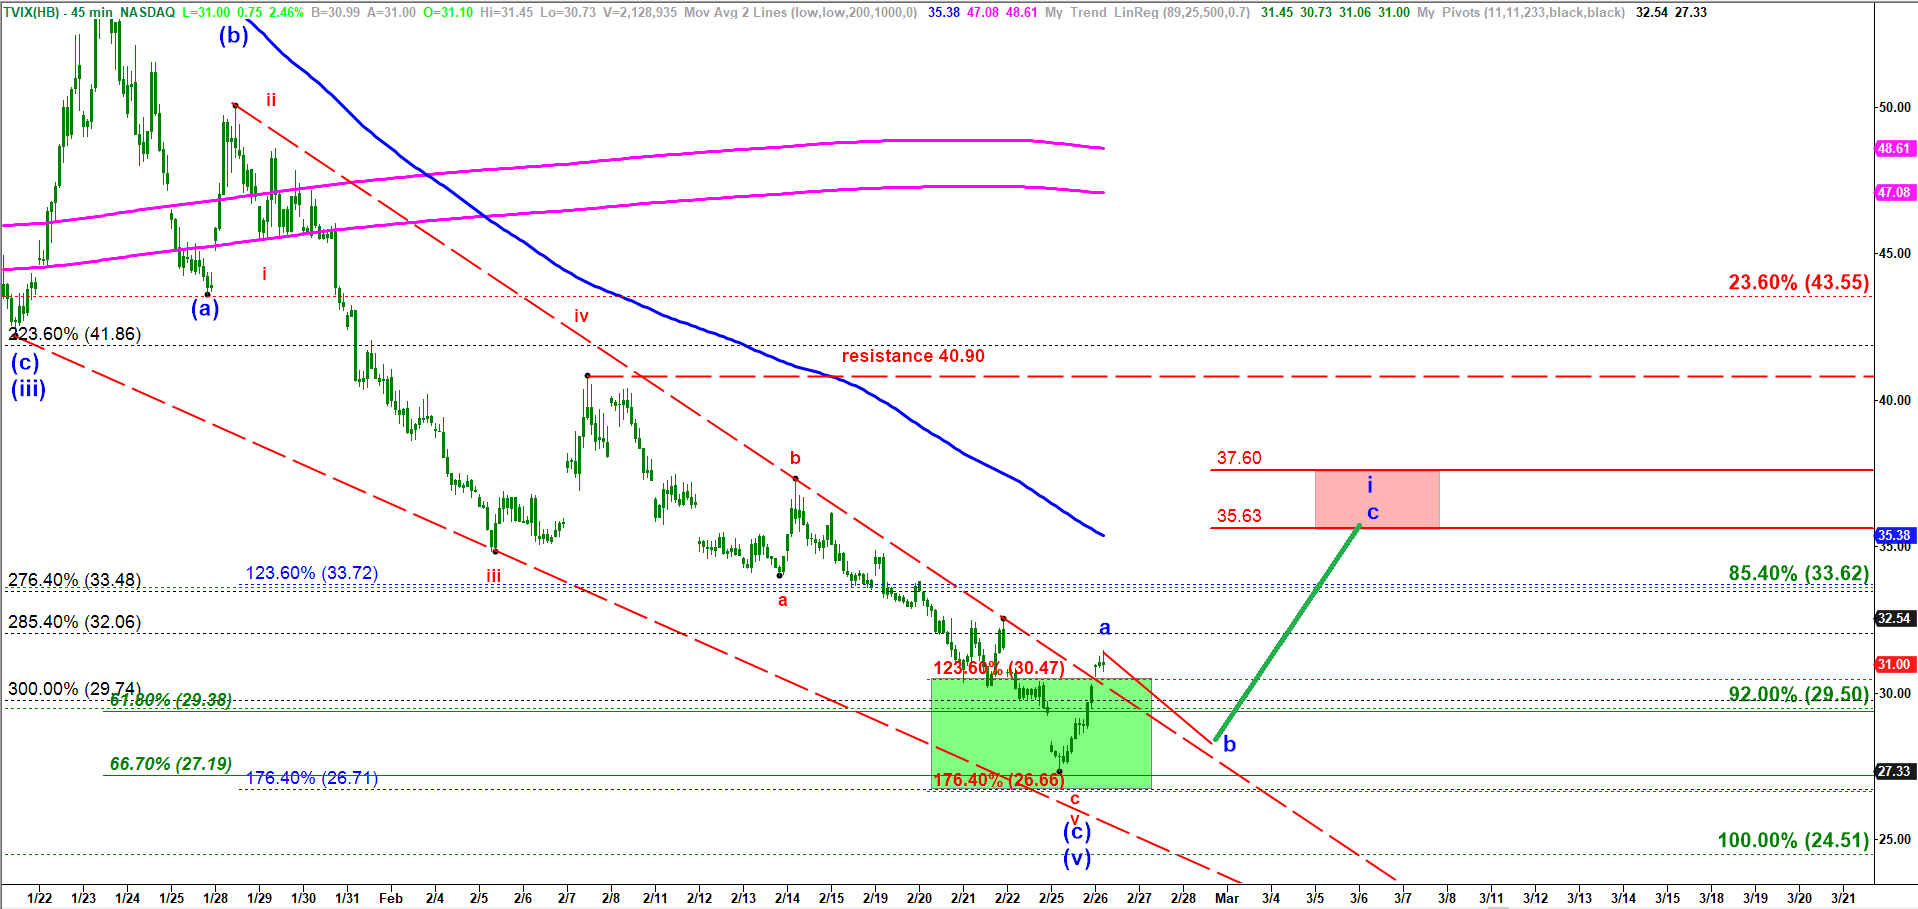
And the strong rally that first filled the gap down and then kept moving higher after close confirmed my outlook. At this point the downside structure off December 2018 top looks having completed. This first small rally looks like wave a of A up. We need to get a pullback down in wave b that may retest psychological level at 30.00. Off that higher low we may get a stronger rally targeting 35.60 – 37.60

TVIX - 15 min chart updated on 26 February 2019

Start to learn how to predict the next market move today!
Check out my latest updates

Read my Blog

© 2025 CastAway Trader • Built with GeneratePress