Crude may quickly drop to $50
Finally crude has reached my target zone I first showed on my chart a month ago.
I believe that crude bottomed in December in wave A of 5 down. That means that the rally off the December bottom is corrective. As soon as it gets exhausted we will see a strong drop under 2016 lows.
But this current move up has to be structured as (a) up, then ( b ) down and finally ( c ) up.
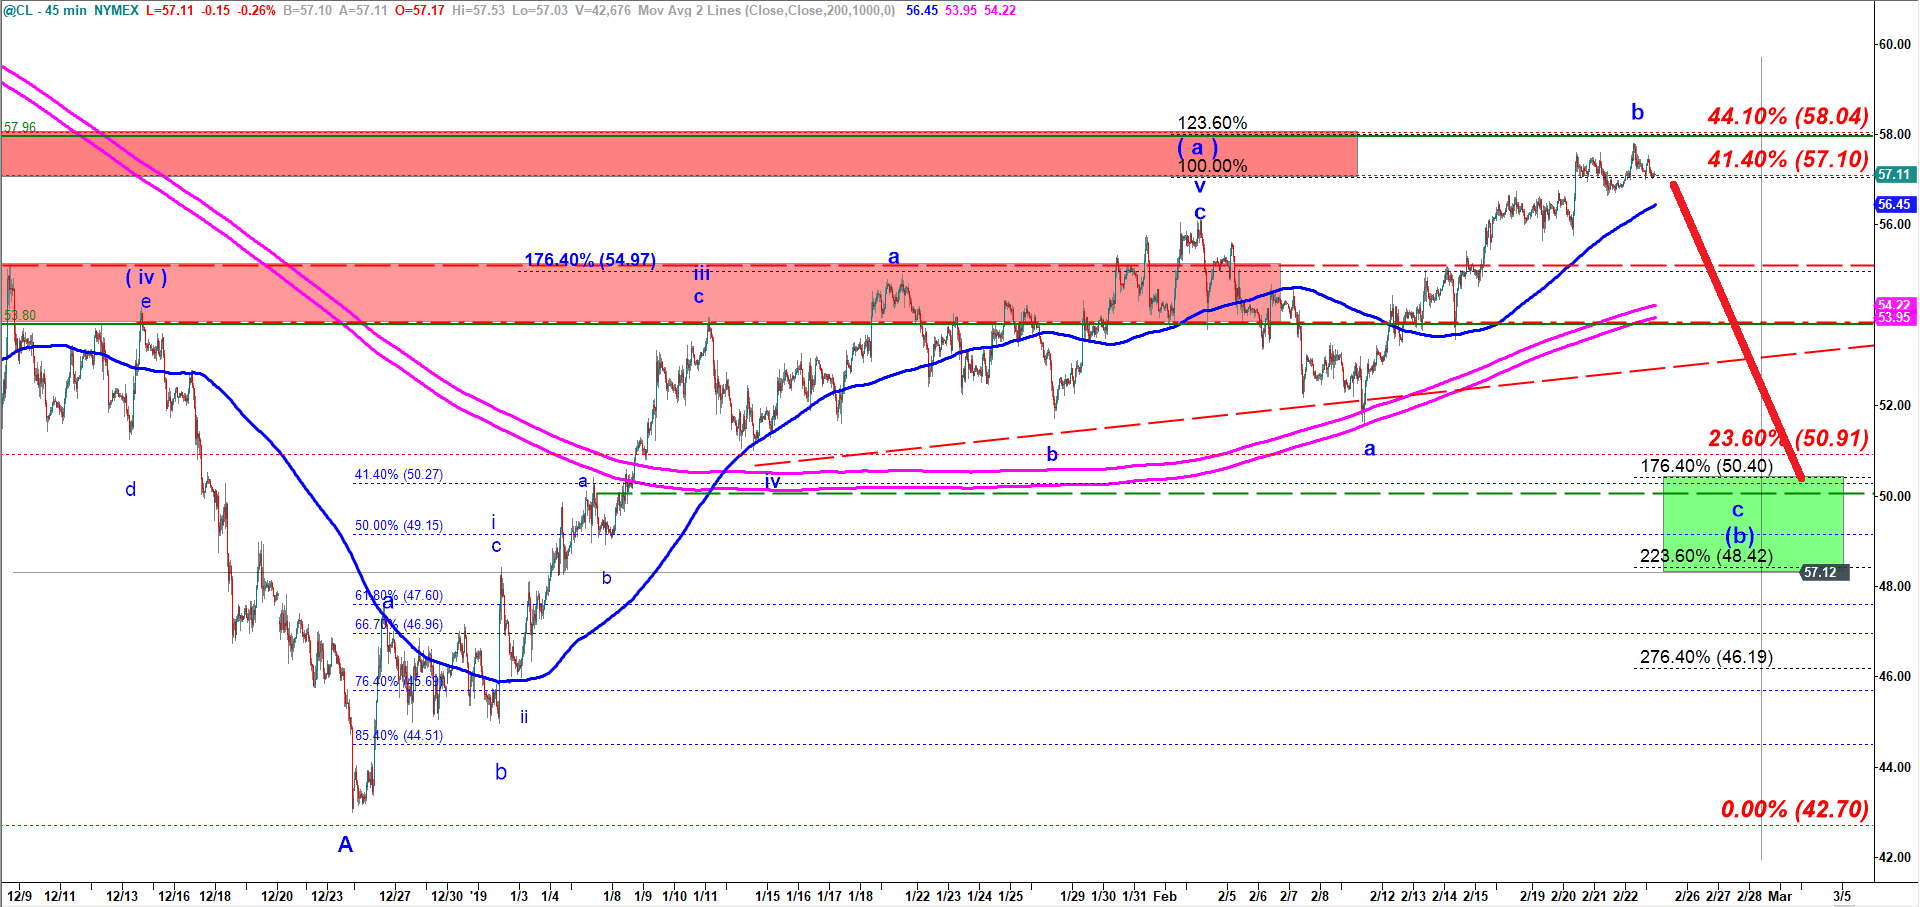
We have completed subwave (a) up at 56.14 on 4 Feb 2019.
Since then crude has been playing a wave ( b ) down shaped as an expanded flat corrective structure. Under the expanded flat structure wave b up of ( b ) down managed to make a new higher high over the top of the wave ( a ) up. To complete that wave ( b ) down we should get a drop in an impulsive wave c of ( b ) down targeting 50.40-48.42.
As soon as that wave ( b ) down gets completed we may get another strong rally in wave ( c ) of B up.
Crude - 45 min chart updated on 24 February 2019