Russell - hit an important resistance
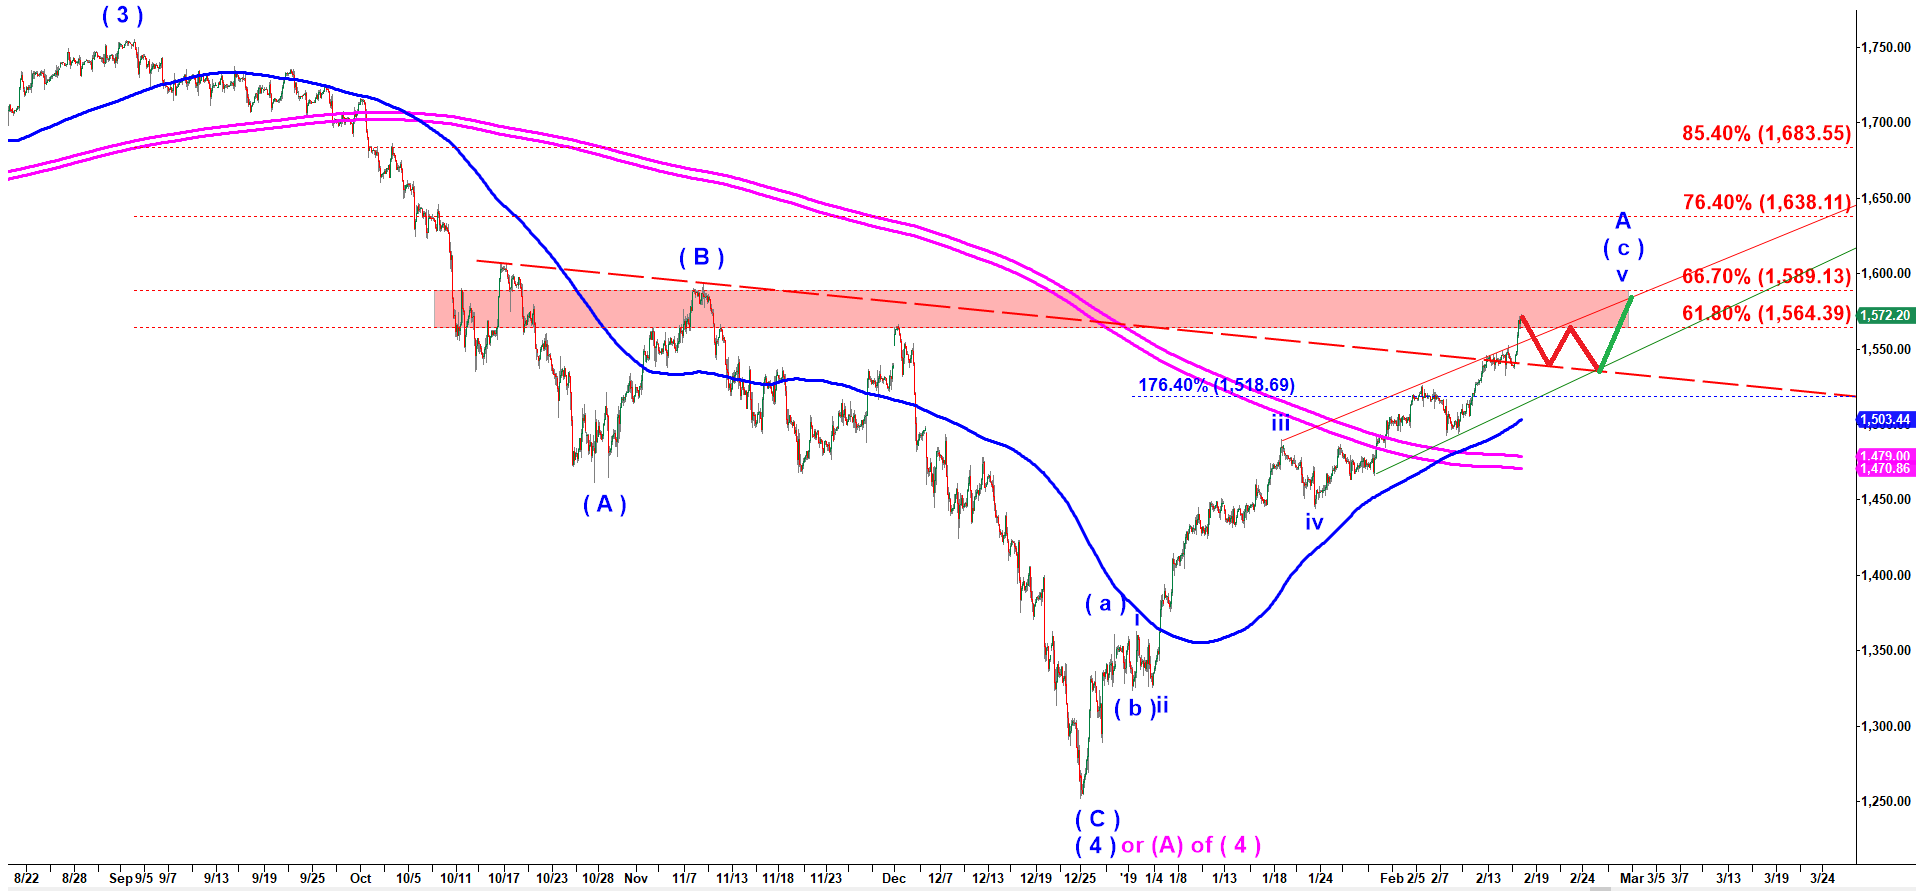
Futures on Russell-2000 index has hit an important 61.8% retracement fib of the whole decline off September 2018 top into December 2018 bottom.
I count that rally as (a)-(b)-(c) structure. The very last thrust on Friday hit a very important 223.6% extension of the wave ( a ) up. The price arrived into the red target box formed by two peaks dated accordingly 11/08/2018 and 12/03/2018. However,a micro structure of the move off the low marked as iv down made on 01/23/2019 looks very vague. Firs we should note that it has a weaker upward slope than in preceding rally counted as wave iii up. That tells me its a wave v up. But to make it look completed we should get a pullback to the declining dashed red line and then another small rally to one more higher high. I drew a potential path on the chat below. Zooming-out Russell has arrived into a very strong resistance zone. It may make one more high hitting 66.7% retracement fib at 1,589 but may reverse even without that move. To confirm a reversal RTY should close under that green uptrend line.
RTY - 120 min chart updated on 16 February 2019