Emerging Markets have a great long setup for a rally to a new all-time high
EEM is the iShares MSCI Emerging Markets ETF seeks to track the investment results of an index composed of large- and mid-capitalization emerging market equities.
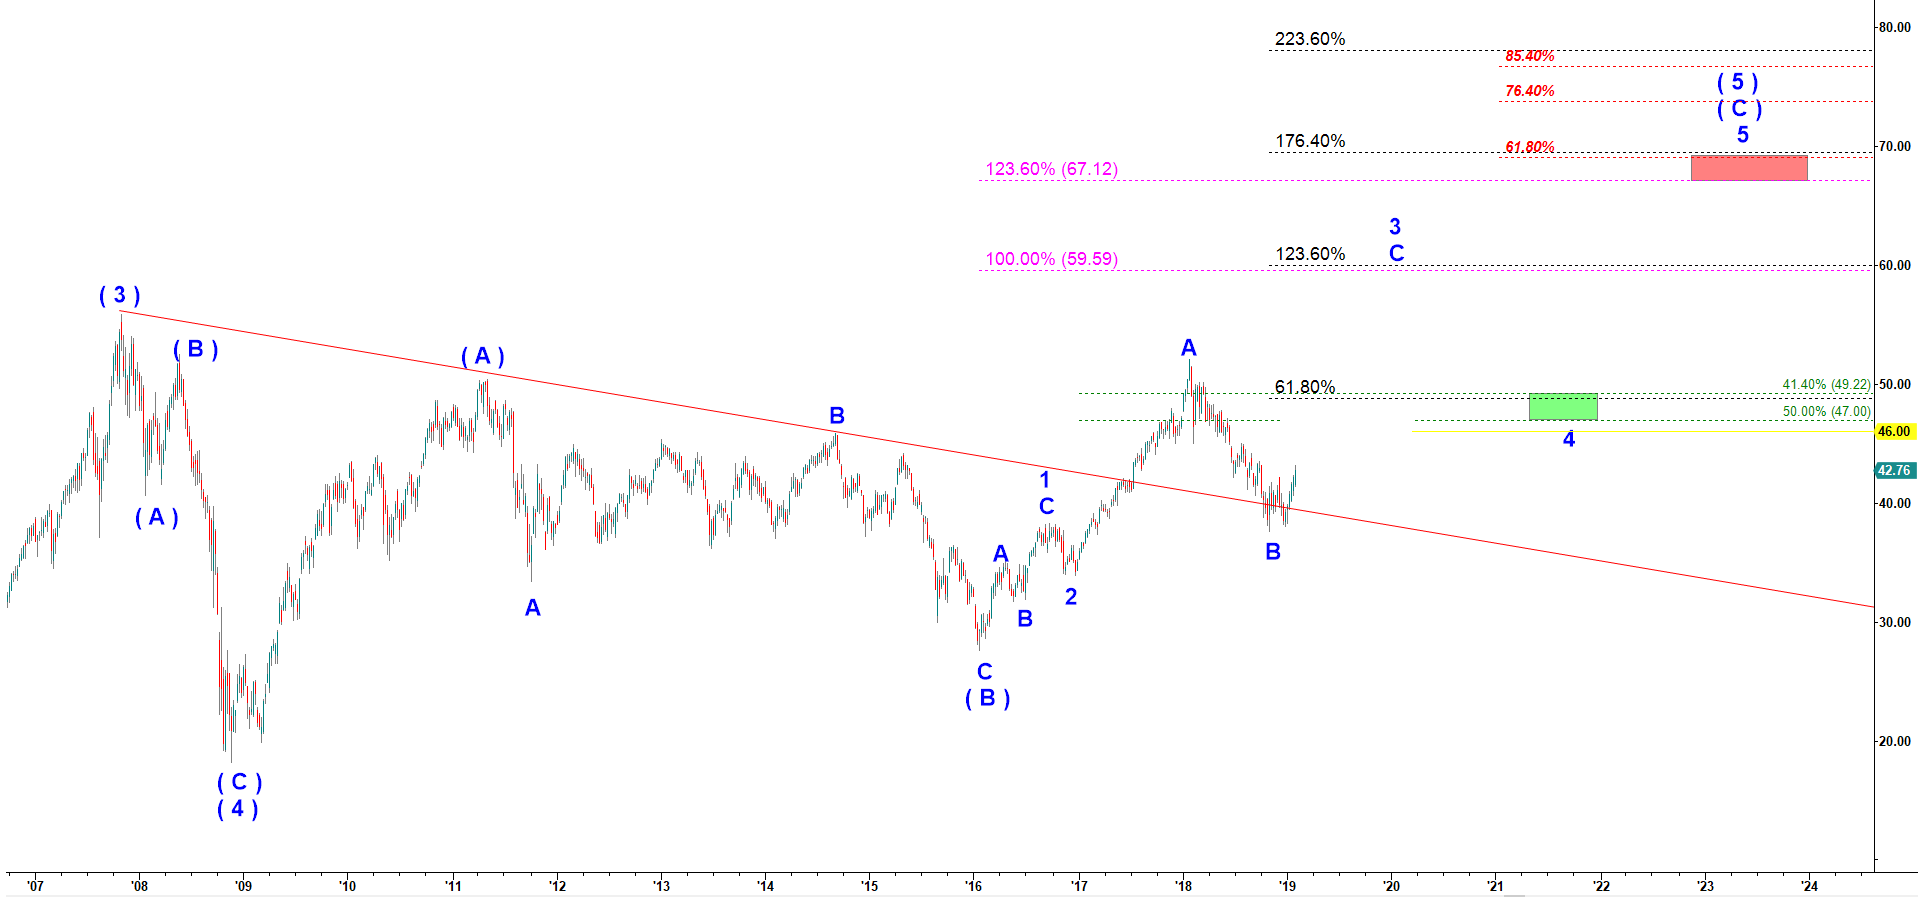
The major top made by EEM in 2017 looks like the top of the large wave ( 3 ) up. Off that top it made a corrective decline shaped as (A)-(B)-(C) down which we should count as wave ( 4 ) down. Then another rally in wave (A) of ( 5 ) up made a lower high and topped in May 2011. This is a textbook wave (A) of ( 5 ). It almost always is unable not only to break out over the top of a previous rally in wave ( 3 ) up but also is too weak to retest it. Therefore, it normally tops out by retracing 76.4%, 85.4% or 92% of the decline in wave ( 4 ) down.
Off May 2011 high we got a corrective decline in wave ( B ) down that held well above the critical support at the low of the corrective wave ( 4 ) down. The wave ( B ) down bottomed in January 2016. Off that low the textbook five wave fractal implies another rally in wave (C) of ( 5 ) up. That wave (C) of ( 5 ) up should make a new higher high over the top made by the wave ( 3 ) up in 2011. Moreover, we know that wave (C) of ( 5 ) has to be subdivided into five waves of a smaller degree. And so far it has been following nicely an impulsive structure. The low made in November 2019 is the bottom of a corrective wave B of 3. From that low we should get the strongest part of the rally in wave C of 3 that should target at minimum $60. However, it may stretch to $70.
EEM - weekly chart updated on 4 February 2019