Skip to content
  • Home
  • US Market Updates
  • Indicators
    • Impulse Master
    • Cycle Trader
    • GANN Levels
    • Subscribe
  • Education
    • Beginners Video Course
    • Intermediate Video Course
      • Syllabus of the Course
    • Trading Like A Pro Video Course
    • Video Lesson of the Week
  • Chat Room
  • Pricing
  • FAQ
  • My Account
  • Login

Bitcoin - breakout through the top of a falling wedge will confirm start of a new rally

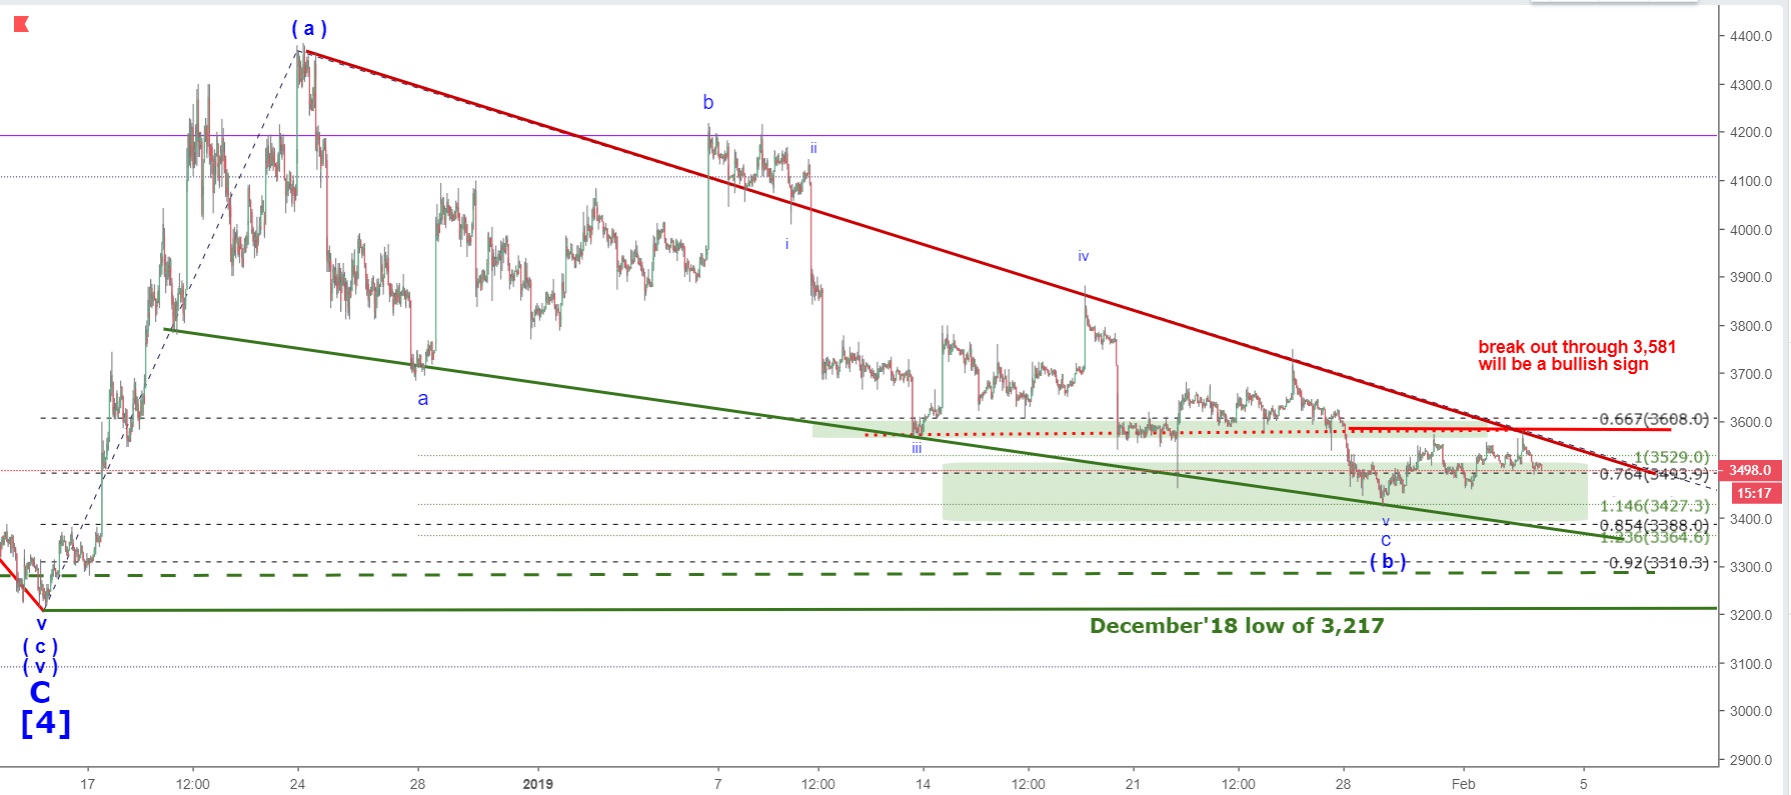
My count has not changed. I count that decline off the top at 4,368 made in December 2018 as the top of wave ( a ) up off the low at 3,217.

Not only that corrective wave ( b ) down has a fully completed structure but it also looks like a falling wedge, an easily recognized technical pattern likened by many traders. Now it’s an easy setup. A breakout over 3,600 would confirm completion of a corrective wave ( b ) down and give a signal of start of a new rally.

At this point I lower the critical resistance to 3,600. My target for the upcoming move up in wave ( c ) up is still 5,000.

Bitcoin - 30 min chart updated on 3 February 2019

Start to learn how to predict the next market move today!
Get a promo-code for 40% discount valid until 31 Dec 2018

Read my Blog

© 2025 CastAway Trader • Built with GeneratePress