
Gold – my bearish count got invalidated
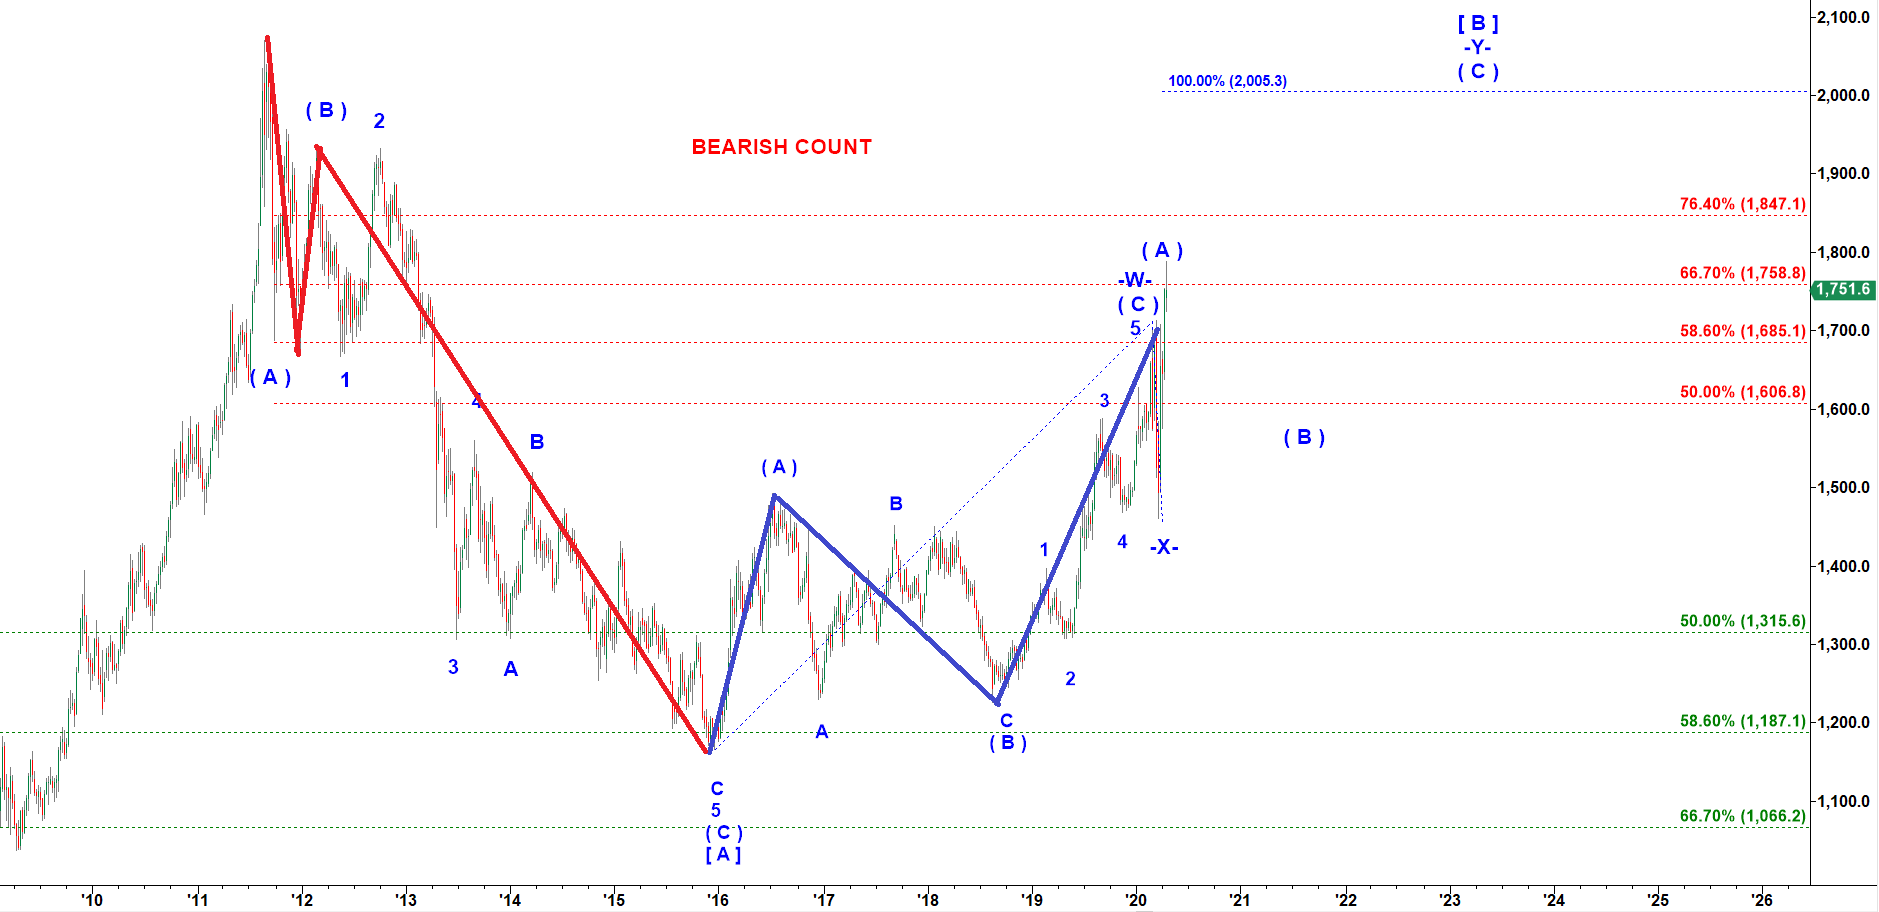
Off the major top made by gold in September 2011 at 2,076 it dropped in a corrective fashion and bottomed at 1,165 in December 2015.
Many bulls believe that was the whole correction and off that 2015 low a new rally started,
For me that means they count the 2011 top as a major wave ( 3 ) up and the drop that followed as a macro corrective wave ( 4 ) down.
That is a reasonable assumption and I can live with that.
However, under that bullish count gold had to rally in an impulsive structure in subwave ( A ) of wave ( 5 ) up off 2015 low.
The problem is that subwave ( A ) of wave ( 5 ) had to come as a strong rally and push price back up to the top made by wave ( 3 ) up in Sep 2011.
However, in that case four years passed since the bottom of wave ( 4 ) down was made in 2015 but price is nowhere close to the top made in Sep 2011!
Moreover, look at the blue zig-zag structure off the December 2015 low, It can not be considered impulsive. It looks rather corrective.
That considerations make me find an alternative bearish count that considers that overlapping move up off 2015 low as a corrective structure of wave ( B ) up to be followed by another impulsive drop in wave ( C ) down.
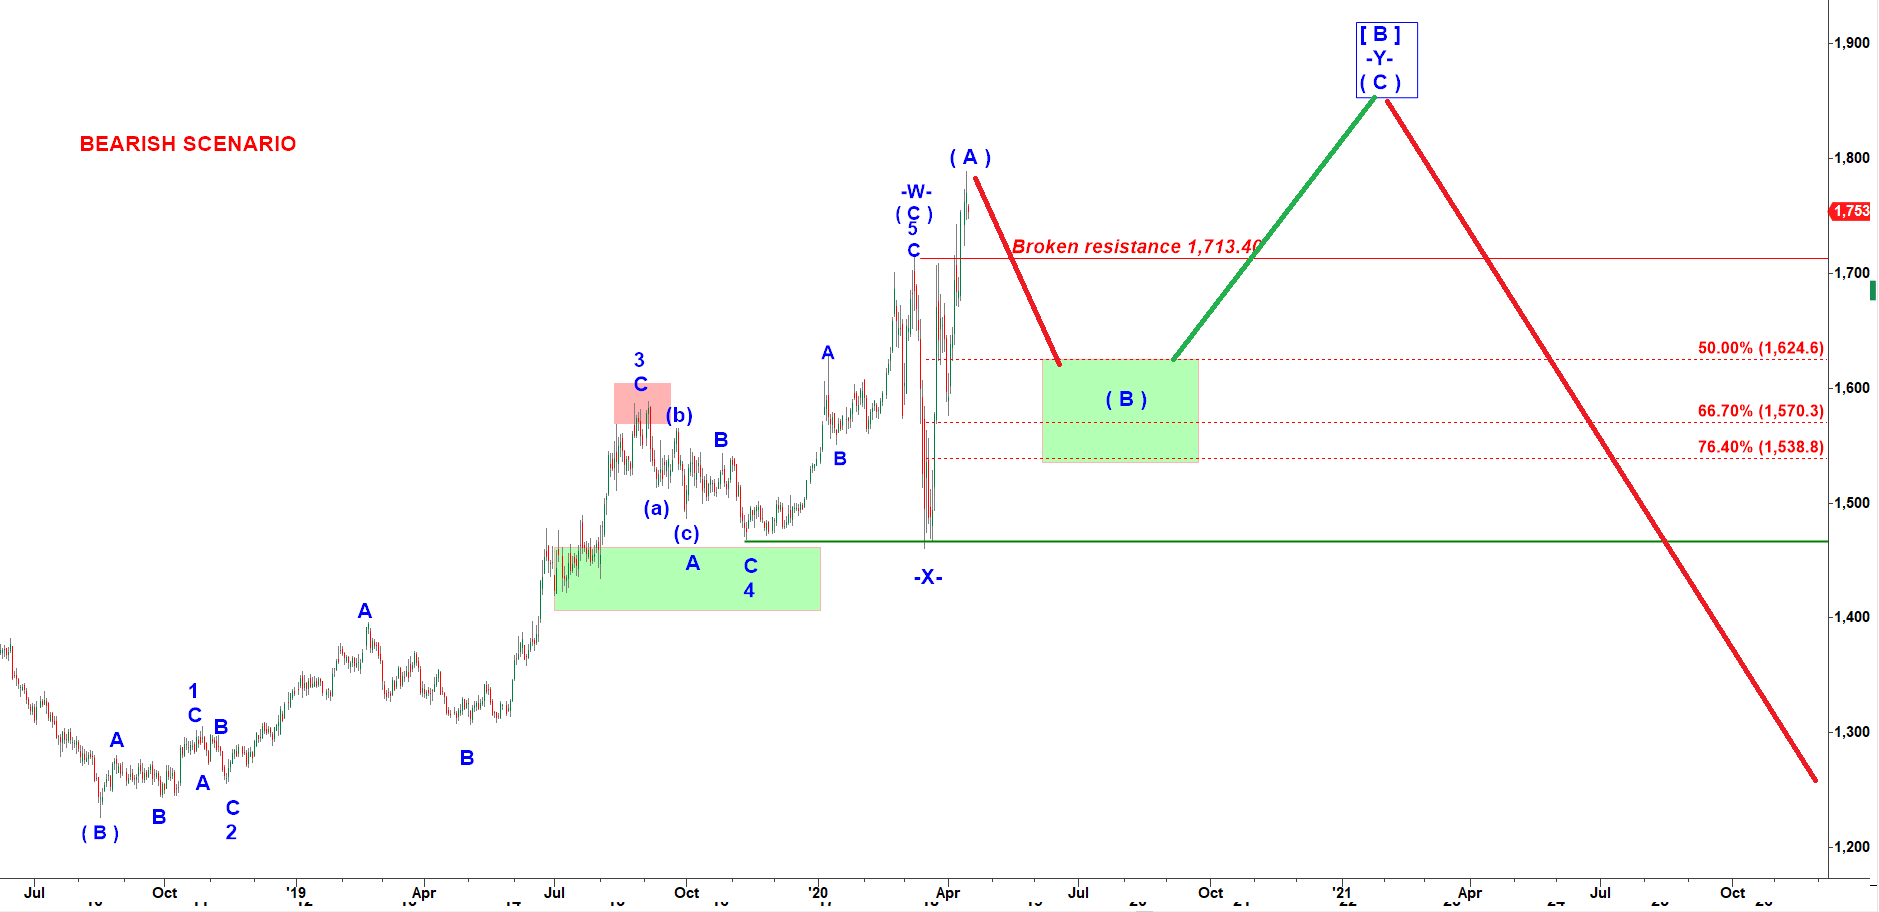
GC - weekly chart updated on 4-14-2020
We had a great bearish count but sometimes even clean counts get invalidated.
That blue (A)-(B)-(C) pullback could be all of wave ( B ) up. When Gold dropped sharply to 1,460 and violated the previous low that was a great confirmation of completion of that move up.
However, on April 6, 2020 Gold managed to make a new higher high and invalidated the original simple bearish count.
Such a straight drop without any A-B-C subdivision could very well be a technical wave -X- that connects two (A)-(B)-(C) structures in the Double Three correction.
Then the rally that we are watching now is the first subwave ( A ) inside the second (A)-(B)-(C) up structure (see the weekly chart above),
That rally in subwave ( A ) up could top already.
It’s barely possible to predict where subwave A up of a new A-B-C structure may top. We will be able to work with retracements for a corrective subwave B down and then with projections for the final subwave C up.
GC - daily chart updated on 4-06-2020
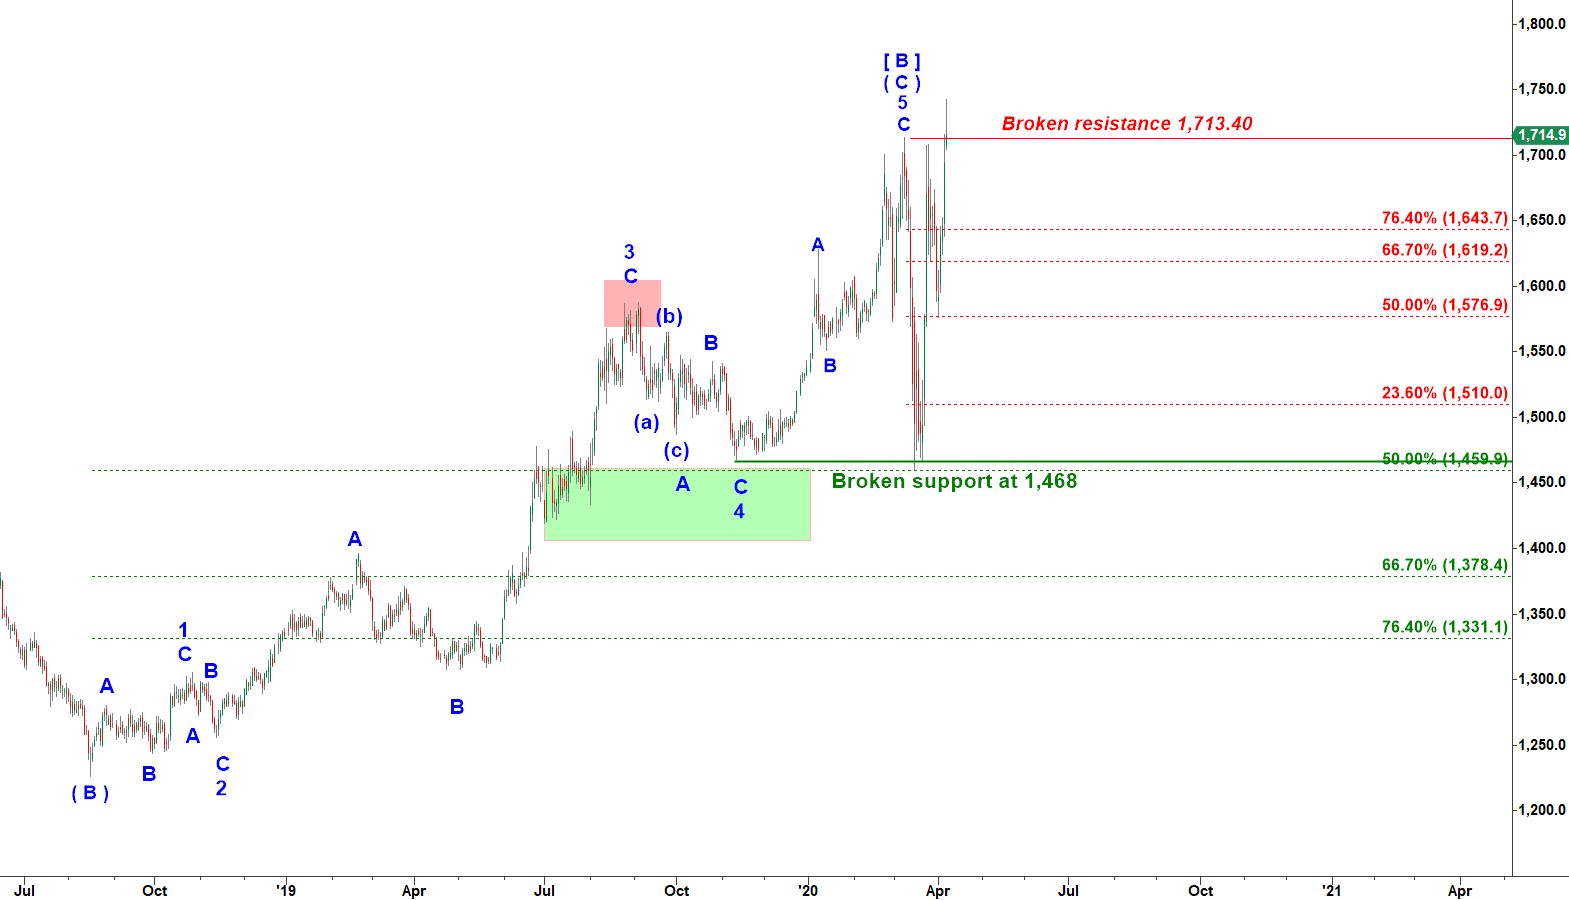
Here we can note that gold got stuck at 1,758, a meaningful 66.7% retracement of the move down that started at the all time low in Sep 2011 to the bottom made in Dec 2015.
If that rally in subwave ( A ) has topped we may get a corrective looking decline in subwave ( B ) down structured as A-B-C. That pullback can retrace 50% – 66.7% of that rally ( 1,624 – 1,538).
GC - daily chart updated on 4-14-2020
Important Disclaimer
CastAway Trader LLC, the publisher of this web-site and videos is not registered as an investment adviser nor a broker/dealer with either the U. S. Securities & Exchange Commission or any state securities regulatory authority. Users of the website www.castawaytrader.com and viewers of the videos are advised that all information presented on the website is solely for informational purposes, is not intended to be used as a personalized investment recommendation, and is not attuned to any specific portfolio or to any user’s particular investment needs or objectives.
Trading stocks, options, or futures carries a high level of risk, and may not be suitable for all investors. Before deciding to trade, you should carefully consider your objectives, financial situation, needs and level of experience. CastAway Trader LLC provides general overview of trading methods that does not take into account your objectives, financial situation or needs. The content of this website must not be construed as personal advice. All trading setups and/or trades presented in the web site and/or trading chat room by CastAway Trader an/or by other members of the chat should be considered hypothetical for educational purposes only and should not be expected to be replicated in a live trading account.
An investor could potentially lose all or more than the initial investment. You should not speculate with capital that you cannot afford to lose. Only risk capital should be used for trading and only those with sufficient risk capital should consider trading. Risk capital is money that can be lost without jeopardizing ones’ financial security or life style.
You should be aware of all the risks associated with trading. You should seek advice from an independent financial advisor.
Any information posted on this web site is not to be construed as an offer to sell or the solicitation of an offer to buy, nor is it to be construed as a recommendation to buy, hold or sell (short or otherwise) any security. All users of the website must determine for themselves what specific investments to make or not make and are urged to consult with their own independent financial advisors with respect to any investment decision. The reader bears responsibility for his/her own investment research and decisions, should seek the advice of a qualified securities professional before making any investment, and investigate and fully understand any and all risks before investing. All opinions, analyses and information posted on the website are based on sources believed to be reliable and written in good faith, but should be independently verified, and no representation or warranty of any kind, express or implied, is made, including but not limited to any representation or warranty concerning accuracy, completeness, correctness, timeliness or appropriateness. In addition, CastAwayTrader LLC and its officers and employees undertake no responsibility to notify such opinions, analyses or information or to keep such opinions, analyses or information current. Also be aware that the owners, officers and employees of the web site www.castawaytrader.com may have long or short positions in securities that may be discussed on the website, Premium Trading Chat room and/or in the videos posted by CastAway Trader LLC.
Past results are not indicative of future profits.
