$ES #ES-mini #Elliott Wave #trading setup
I consider the October rally as a subwave -b- up of a corrective consolidation in a wave (b) down:
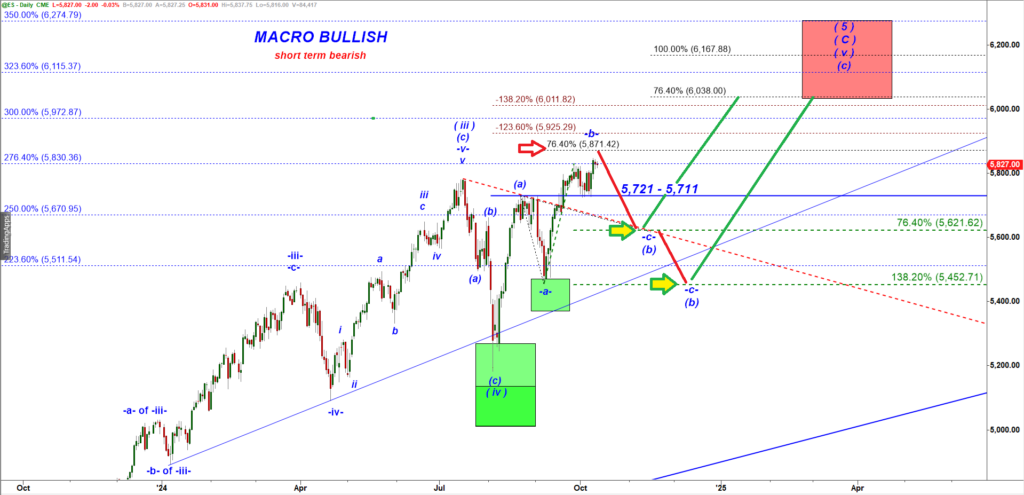
ES-mini Daily chart
Let’s combine the wave analysis with application of the Month Opening Range startegy:
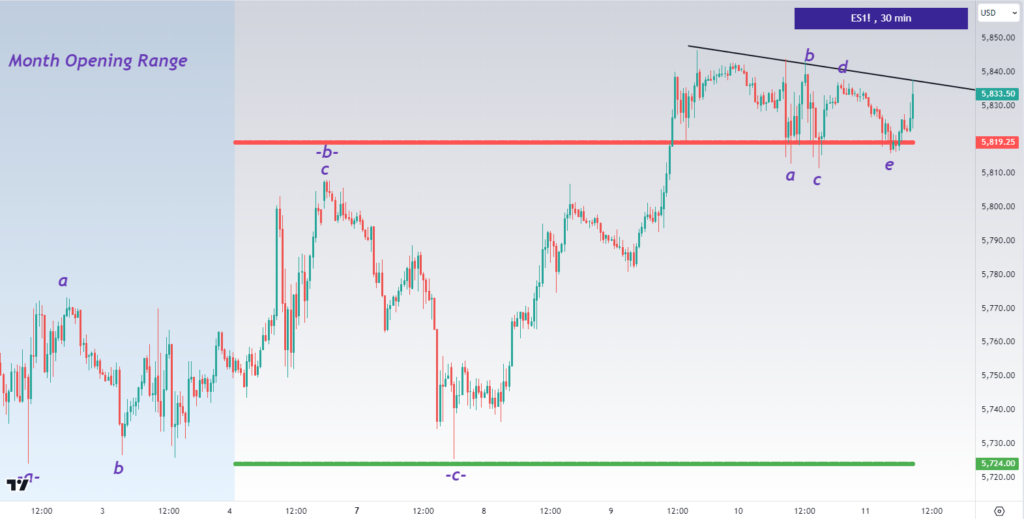
ES-mini 30 min chart
The market establishes the Month Opening Range during the first three trading days of a month. Bulls broke out over the Monthly Resistance 5819.25 on Oct 9, 2024.
Once getting broken, the monthly resistance becomes a strong support. Break over the red monthly resistance means the intra month trend turns up. Note how price built a flat base OVER the broken resistance.
A flat consolidation over the broken resistance is a very bullish sign because it builds a base for a potential new leg up.
PLAN A Bullish: We can count the whipsaw over the monthly support as a a competed corrective triangle, a base for a breakout that should start a new leg up(edited)
On a daily chart above I have marked up a target for a potential leg up, 5,871.50, at 76.4% ext of the wave (a) up
PLAN B: Now let me remind you that a sucessfull trader has to have bipolar thinking.
What I mean is that now we have a new meaningful well established support 5,819.25. If bull fail here to start a new leg up and allow bears to push ES back UNDER 5,819.25 that would be a nice short setup that would allow bears to quickly push ES down to the Monthly support 5,724.