$ES #ES-mini #Elliott Wave #trading setup
ES mini has been in a tight range consolidation for five trading days:
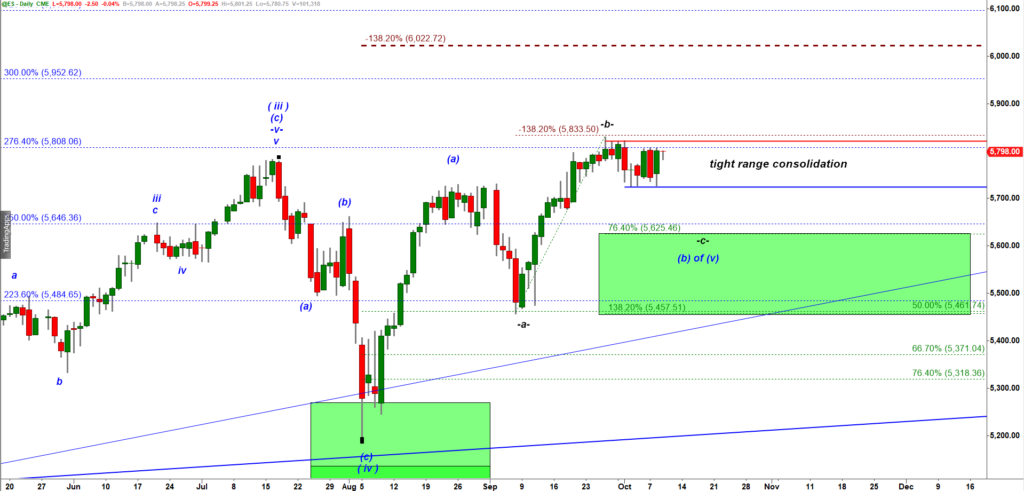
ES-mini Daily chart
Elliott Wave theory is a powerful tool when we deal with a trending market. In contrast a directionless range bound consolidation allows multiple interpretations.
For example, here bears can make a case for a drop:
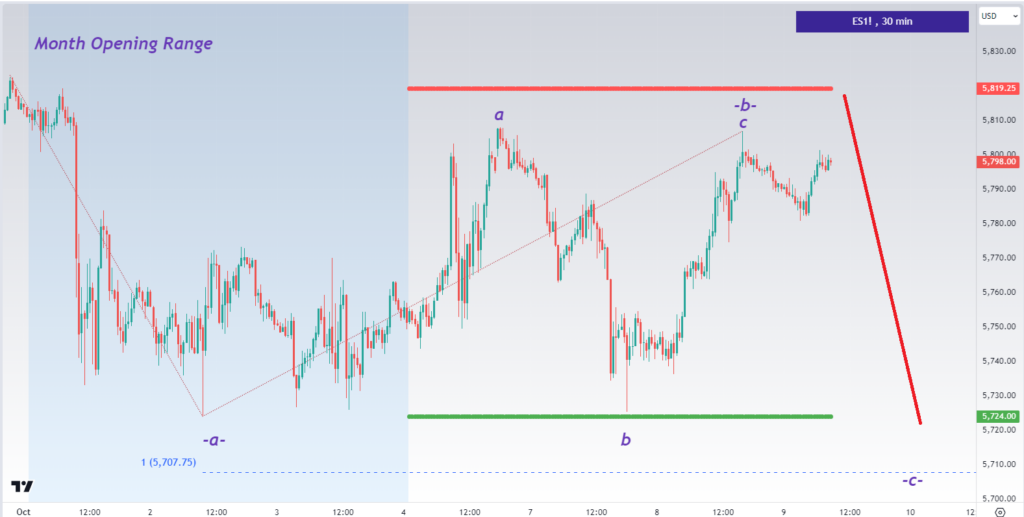
ES-mini 60 min chart
But bulls may argue that the whole corrective -a-b-c- down has completed:
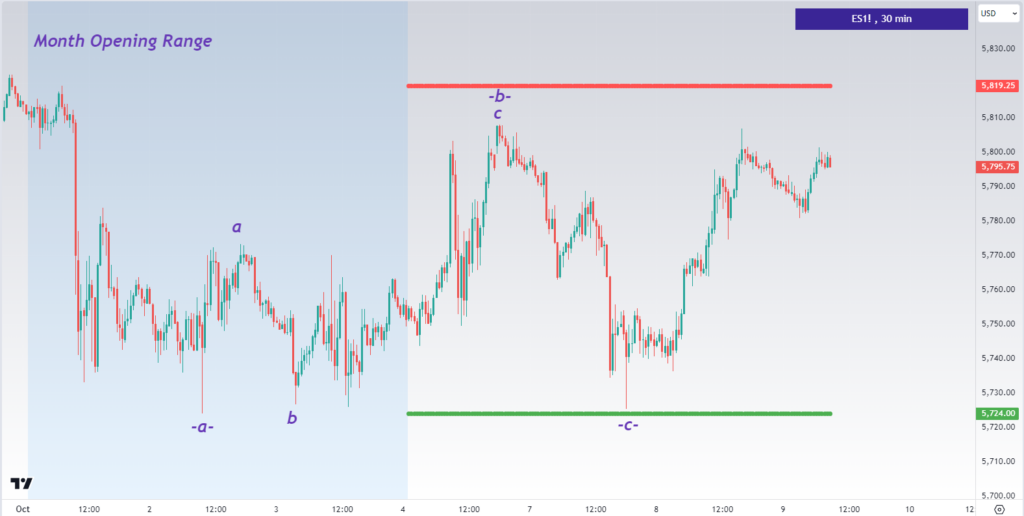
ES-mini 60 min chart
If the -a-b-c- down corrective structure got completed then ES is starting another leg up. That bullish scenario would get triggered by breaking out over the Monthly Resistance 5,819.25
The trading range created during the first three trading days of a month can be considered the Month Opening Range. The high and low prices made during those three trading days often continue to work as important price levels during the following four weeks.
That theory argues an intra month trending move starts from breaking over the Monthly Resistance (5,819.25 in this case).
An intra month down trending move starts from breaking under the Monthly support 5,724.