$NQ #NQ #Elliott Wave #trading setup
Today bulls finally tagged the Red Box we have been watching for weeks:
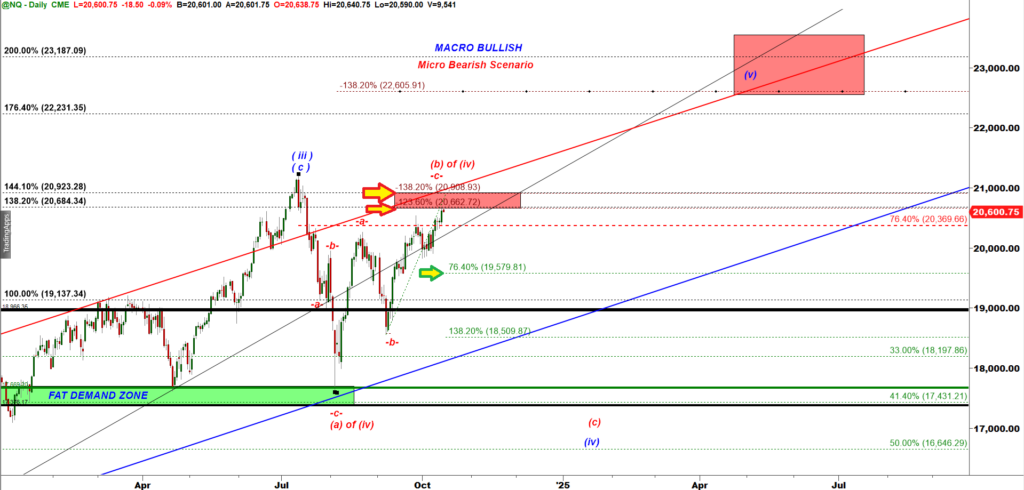
NQ-mini Daily chart
So far they tested the lower edge of the Red Box, a weak resistance at a negative 123.6% ext = 20,662. A much stronger resistance is located at a negative 138.2% ext = 20,908 (at the upper edge of the Red Box).
Let’s dive deeper and look at a micro tick bar chart:
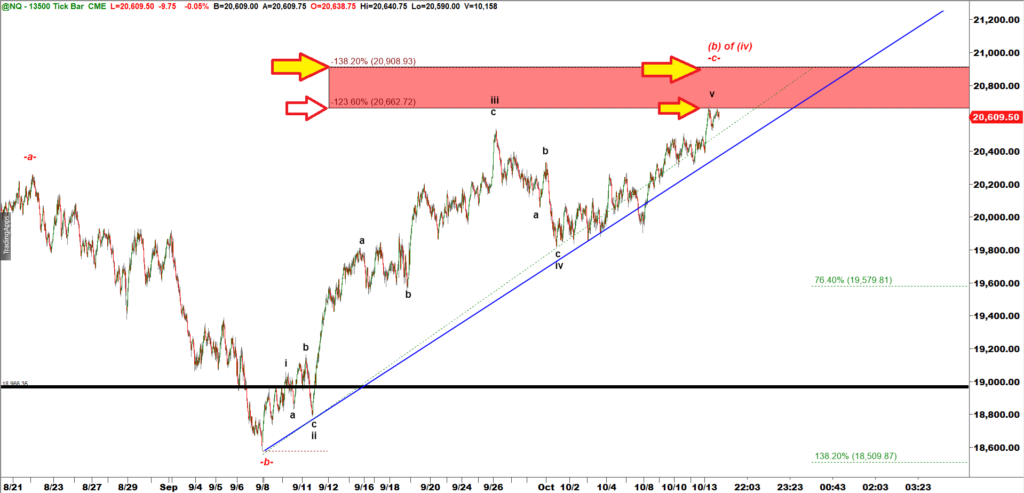
NQ-mini 13,500 tick bar chart
We can see a clearly completed five wave up structure behind that move off the Sep 8 low.
 So we got a completed wave structure right into the resistance of the Red Box.
In case of any bearish move the broken Monthly Resistance at 20,324 would be the very strong support:
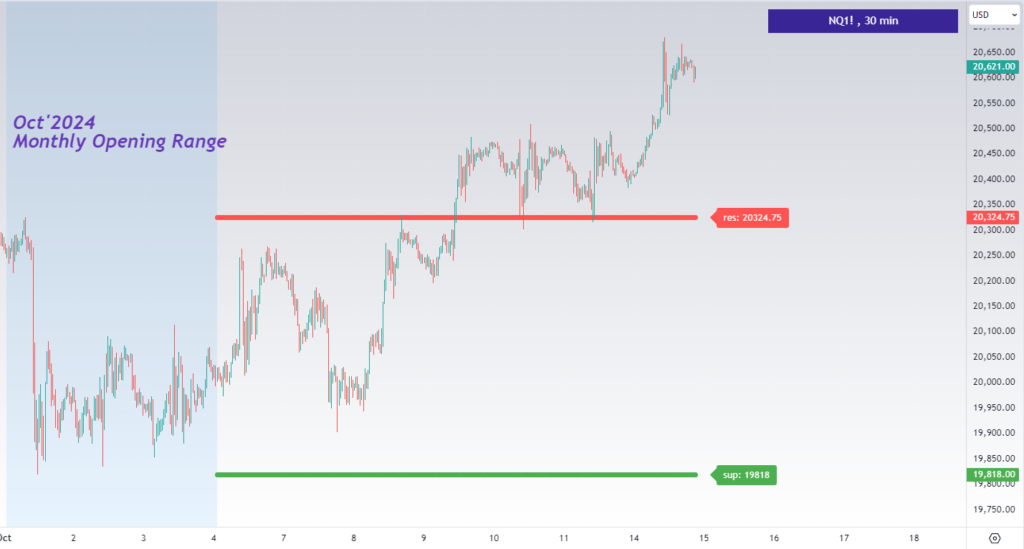
The next strong support would be the Monthly Support at 19,818.
Now look at the low made by the previous pullback in a corrective micro wave iv down:
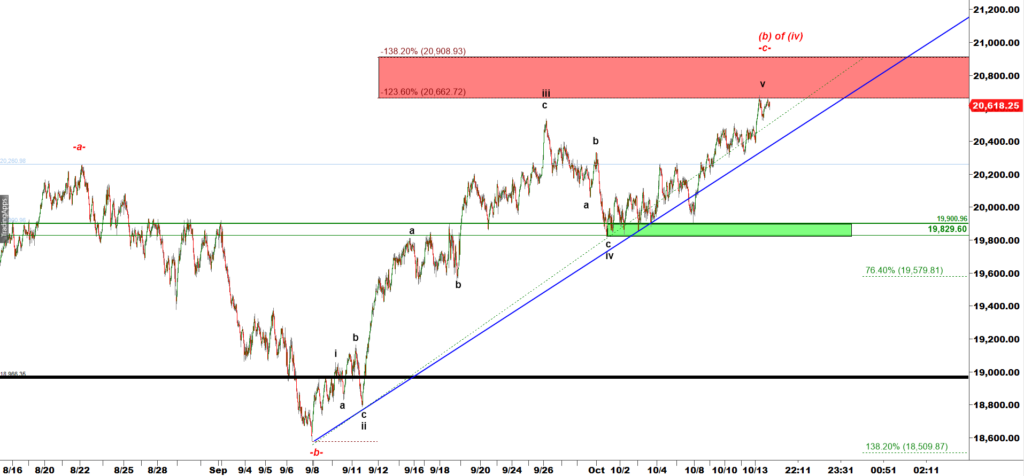
NQ-mini 13,500 tick bar chart
You can see a well established Demand Zone 19,900 – 19,820.
In case of any bearish action we can expect bulls to stop any move down in that green demand zone