$SPX $NQ #trading setups
I am going to show you two amazing fractals that seem to be replaying by S&P 500 and NQ.
Let’s start from S&P cash index:
Look at the bearish reversal Head and Shoulders pattern formed at the top of 2021:
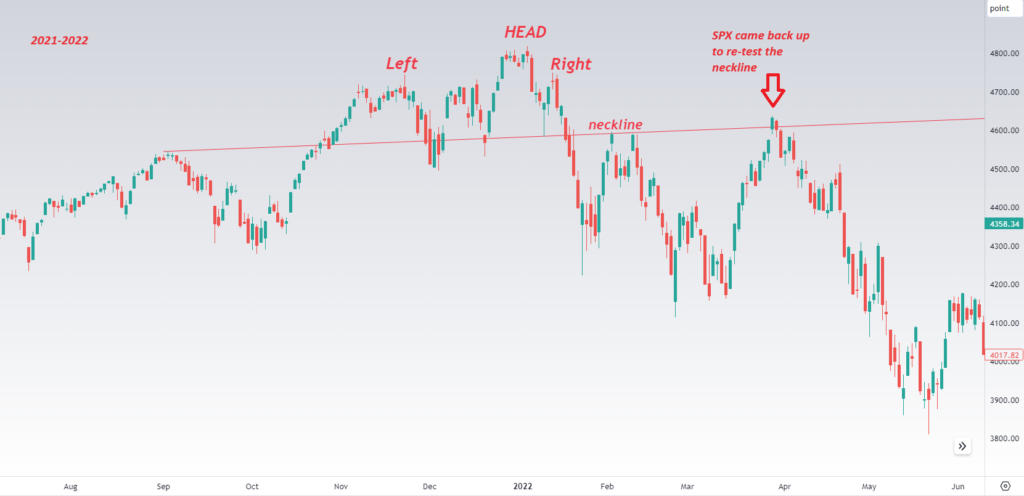
Note that strong rally in April 2022. S&P came back up to re-test the neckline and even overshot it.
Now look at almost identical pattern that is unfolding before our eyes:
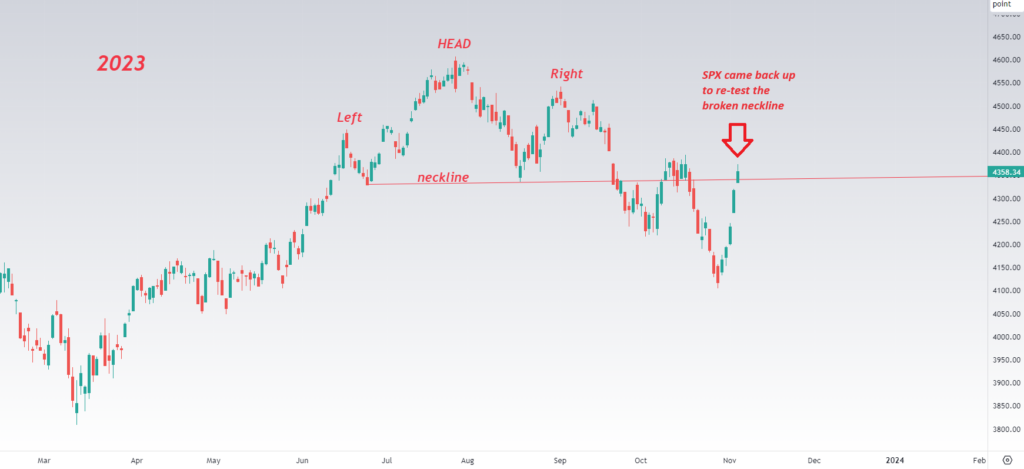
S&P run a similar bounce back up to the neckline…
Now lets look at the rally in NQ-mini off the Oct’22 low into the July 2023 top:
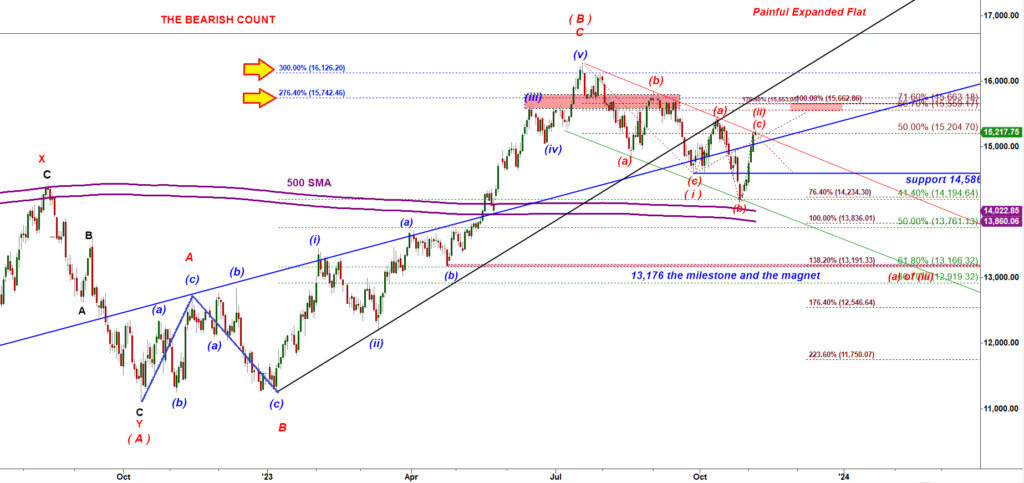
Note NQ-mini made two tops at 276.4% ext and 300% ext in June – July 2023.
And now compare the structure of this big rally to structure of the rally we got last week:
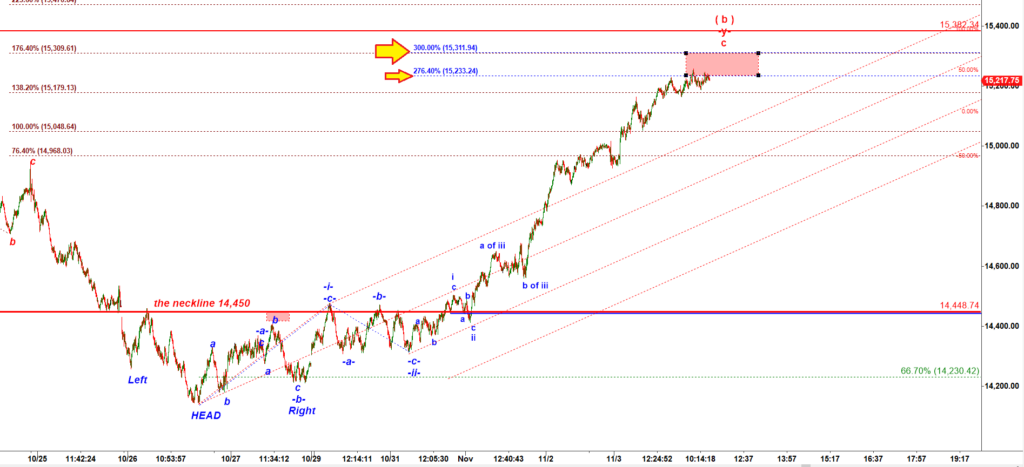
On Friday NQ-mini topped at the 276.4% extension. The second resistance is the 300% ext = 15,312.
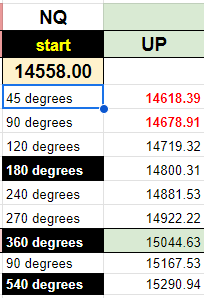
Those levels coincide with two Gann’s levels:
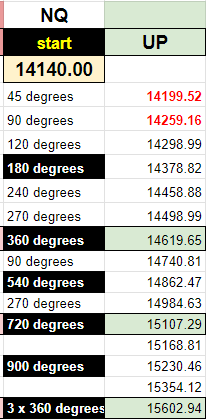
Off the low of the subwave b of wave iii 540 degrees up points to 15,291: