$ES #ES-mini #Monthly Opening Range #trading range
I keep teaching my followers a mighty strategy that helps me a lot in forecasting the market.
That strategy, for example, helped me to correctly predict a bullish reversal on August 18 and a bearish reversal on September 1st.
Let me briefly explain you that strategy. The first three days of a month tends to bring volatile trading. The market sets boundaries for the following four trading weeks.
Once the range has been set, swing traders may wait for the market to break out of the range and consider that breakout or breakdown as confirmation of the prevailing trend direction.
Let me show you a couple of examples:
Note how ES-mini peaked at the end of October 2022, produced a corrective countertrend move during the first three trading days of November 2022:
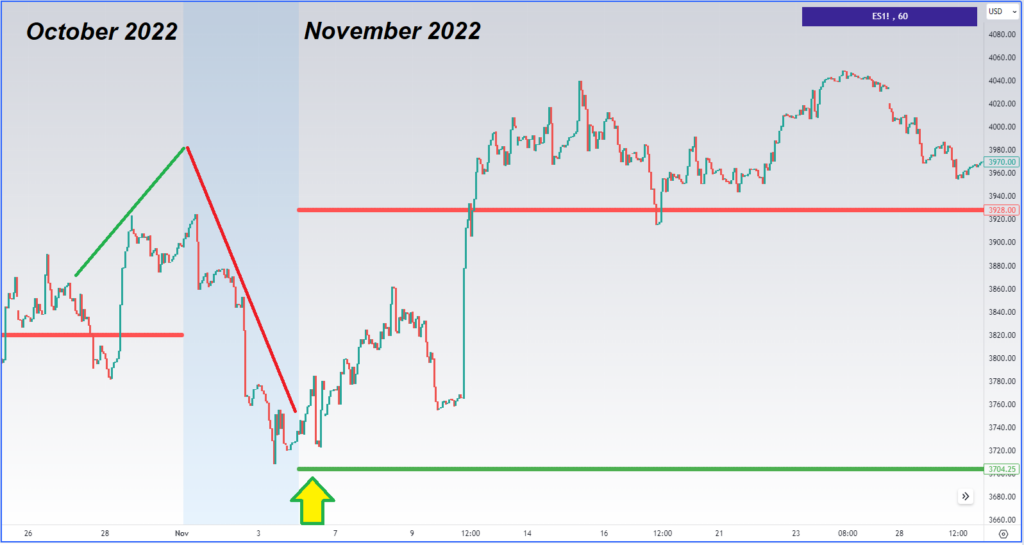
During those first three trading days of November bears produced a three day move down but on the forth trading day of a new month bears gave up. Bulls stepped in and started a new leg up. This is a repeating pattern for an up trending market.
The same pattern played out in June 2023:
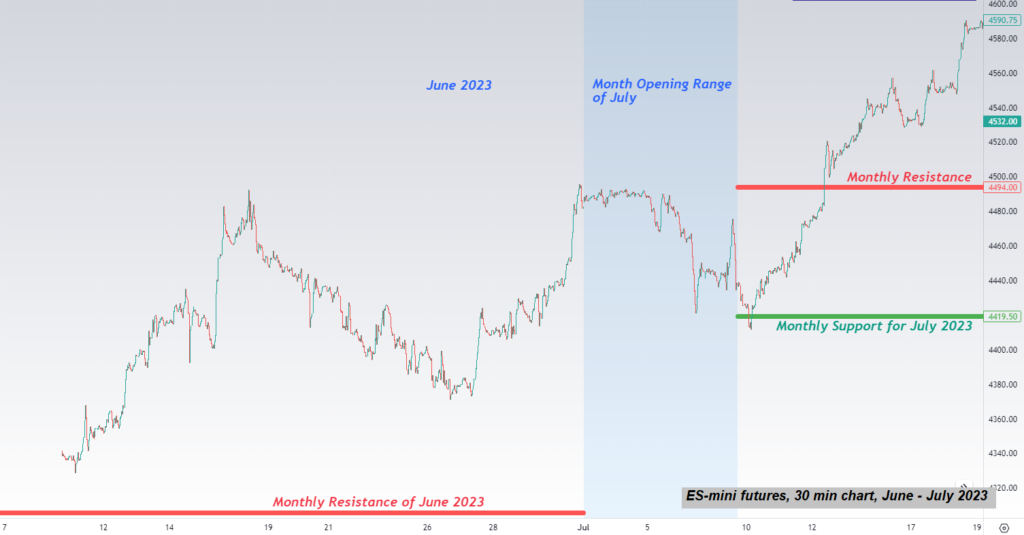
Here you can see how June’23 ended at highs but once July’23 started we got a three day long pullback that set the Monthly Support for July. Bears failed to break under the low of the range established during the first trading days of July’23 and a new strong rally started.
We call the low of the range established during the first three trading days of a month the Monthly Support. And the high of that range is considered the Monthly Resistance.This is how September Opening Range looks like this morning:
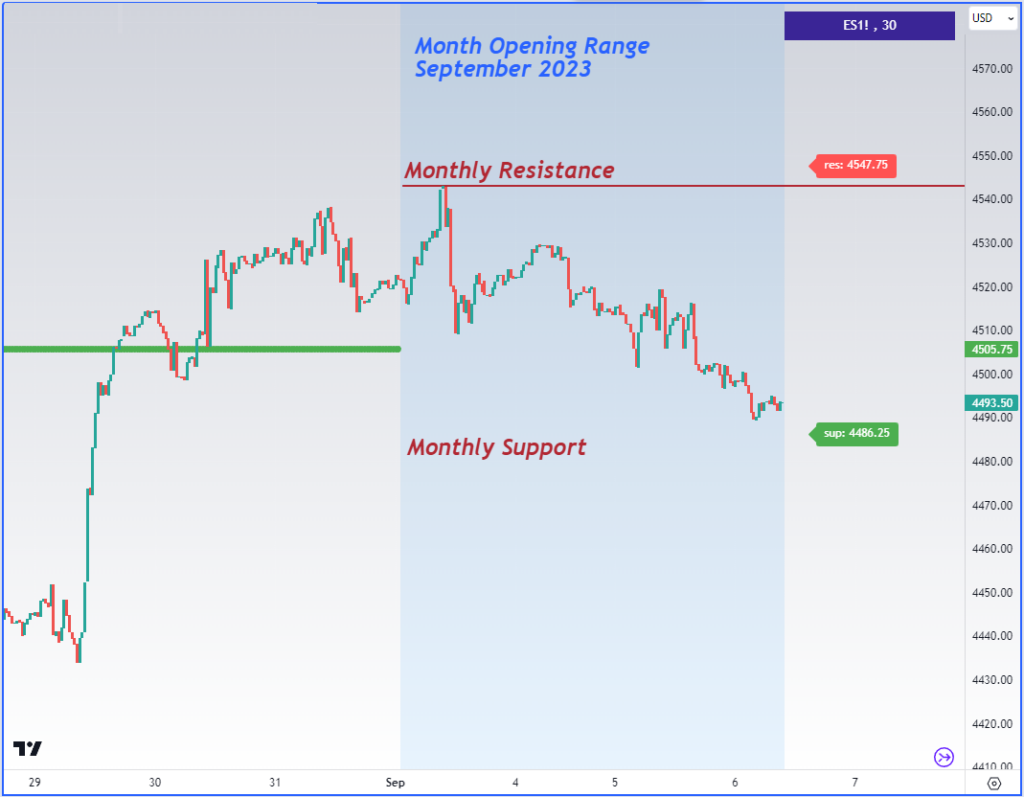
If on Thursday – Friday bears fail to break under the low of the range established during the first three trading days of a month (Friday – Tuesday-Wednesday) that will trigger a quick rally that should push price back up to the high of the range, the Monthly Resistance.
You can read more about the Monthly Opening Range strategy in my blog.