$ES #ES-mini #trading setup #Elliott Wave
On Friday we closed the week with an attractive short setup. I posted that chart last Friday:
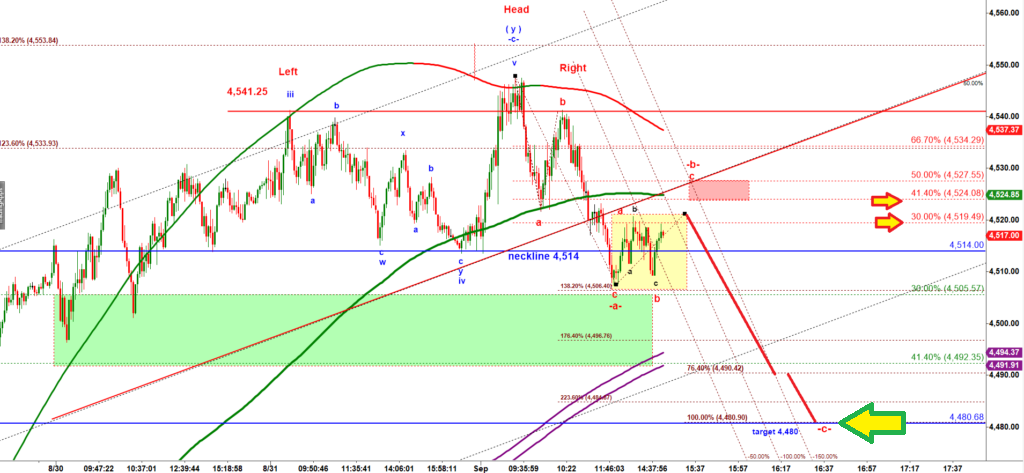
This morning we hit that target.
This is how ES looks like now on a tick bar chart:
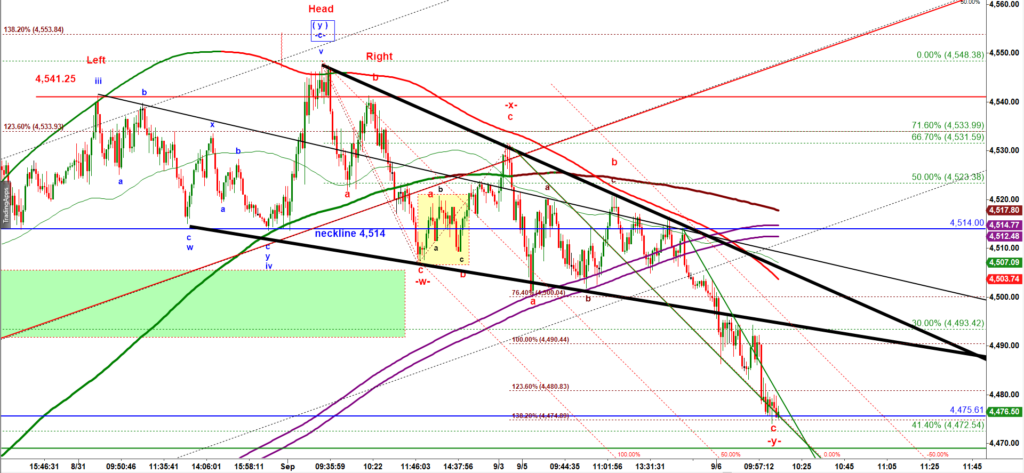
The whole decline can be counted as a corrective -w- down, -x- up, -y- down structure where the second leg down labelled -y- tagged the textbook 138.2% ext.
Bulls have an opportunity to turn ES back up here.
The first challenge for Bulls is to reclaim support of the lower black trend line (4,493), to push ES back inside the black wedge. To trigger the Bullish descending wedge pattern bulls need to pus ES-mini over the upper black trend line (4,500). This is what would be considered a breakout long setup.