$ES #ES #trading setup #bullish wedge #Elliott Wave #trading startegy
The micro Head and Shoulders setup produced a very weak move down. The whole structure off the last high made on Sep 1st looks like a completed corrective -w-x-y- down:
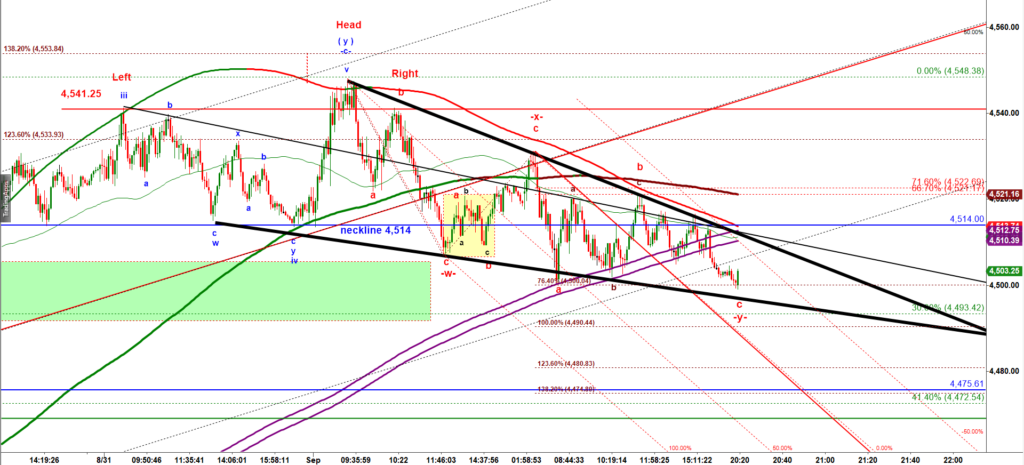
After the Tuesday close ES-mini has made a slightly lower low and by doing that produced enough micro moves to make the whole decline off the last high made on Sep 1 look having completed.
The second leg down in a wave -y- stopped right at 76.4% ext of the first leg down labelled -w- down = 4,500. The whole decline was shaped as a bullish descending wedge widely recognized as a bullish continuation pattern by millions of traders.
Here bulls get a decent long setup to start a new rally. To trigger that bullish wedge pattern bulls need to break over the upper black trend line (over 4,512.75).
Let’s zoom out to a 240 min chart:
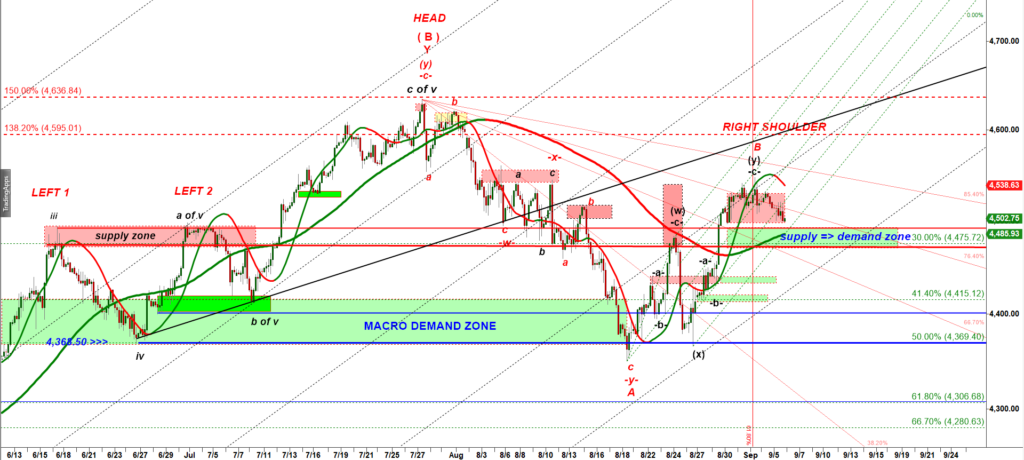
If we look at the 240 min chart we can see that ES-mini approached the green demand zone.
Here bulls consider that slow leaking decline as a corrective pullback. Bulls do not believe that ES-mini made a lasting top. Well they got the micro setup to start another rally that can make a new higher high of the 2023 year. However, I have serious doubts they will be able to do that. If bulls produce a spiky move up off the bullish wedge shown on the first micro chart but that spike stumbles upon 4,525-4,530 – 4,535 making a lower high and then a new decline will follow pushing ES back under 4,500 that would finally convince bulls that the rally is over. This is when a more accelerated decline should begin.