$ES #ES #Weekend #Elliott Wave
In my Thursday report I outlined two alternative scenarios, a bullish and the bearish one. Today we will review them in details. But first I would like to comment on my primary scenario:
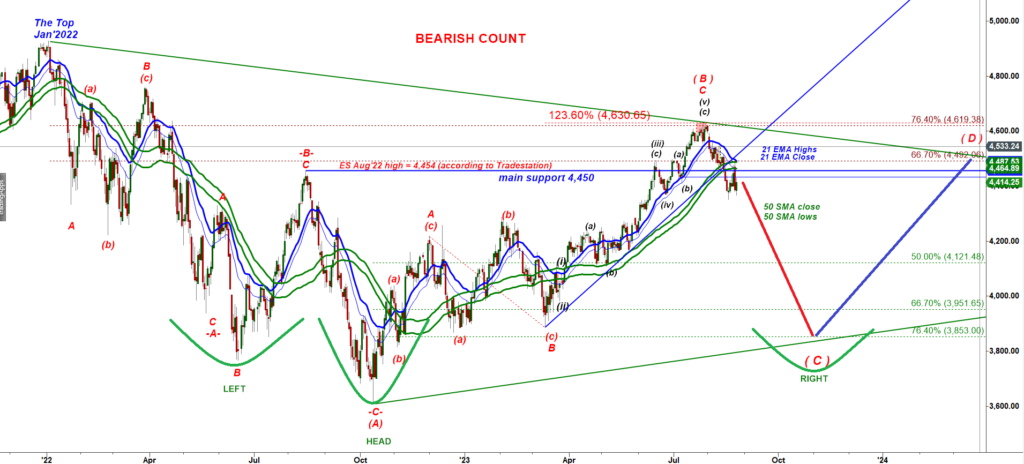
Many bears expect the upcoming second leg down in the wave (C) to break under the October 2022 low. I just noticed that that leg down may make a higher low if it follows the triangle consolidation structure.
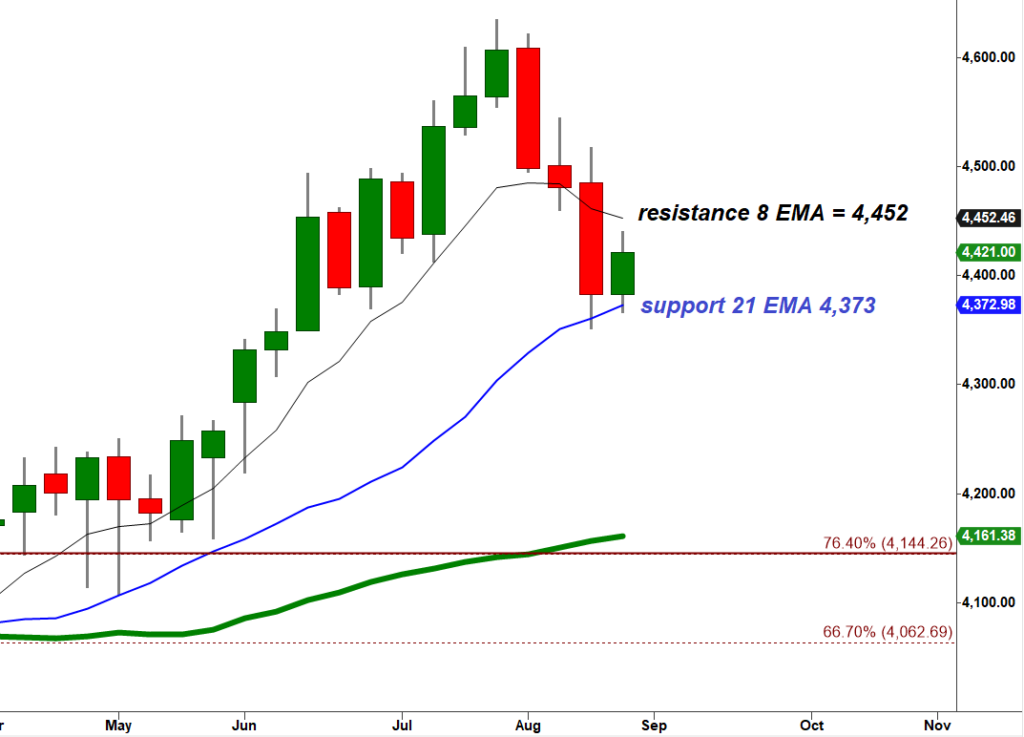
Note that bears managed to close the week under important 20 day and 50 day moving averages:
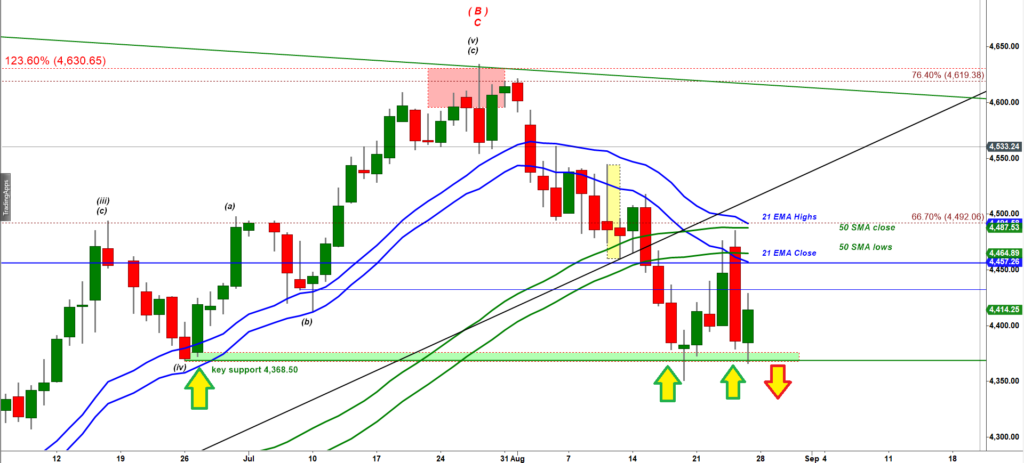
On the chart above you can see how the declining blue EMA 21 Daily stopped a bounce last week. And you can see that the green 50 Day moving average that used to be a support for months now turned into resistance.
This chart is a great illustration to a very important rule of the Elliott Wave theory I really want you to memorize:
“Upon completion of a five wave up structure the first target for a corrective pullback is always the low made by the previous pullback in a micro wave (iv) down.”
Paradoxically main targets for declines turn to be into strong support levels. Those are the key decision points. I added the green stripe that started from the low made by a corrective wave (iv) down in late May 2023. Note that the August Drop stopped right at that level.
This is why to confirm the bearish scenario I will talk about below bears really need tp push ES-mini UNDER 4,368.50, the key support.
That Daily chart shown above looks really bearish. But the problem is that the weekly chart does not look bearish yet:
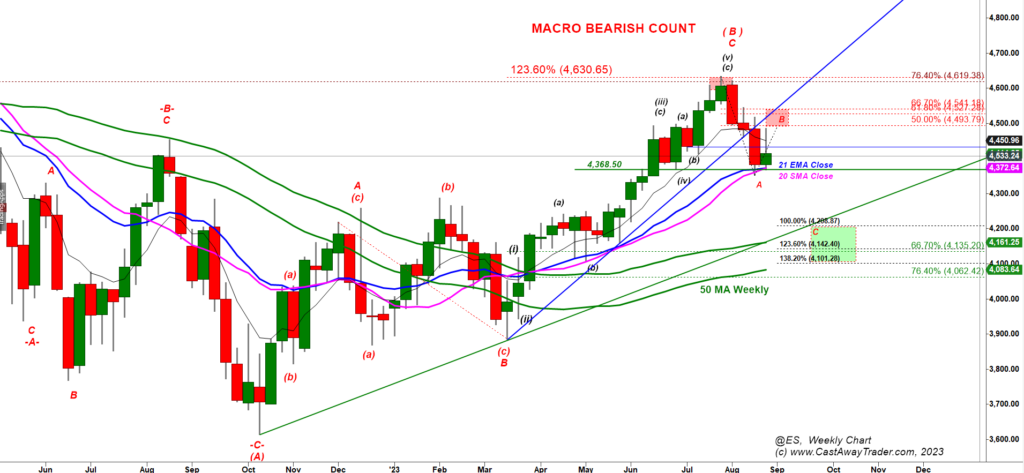
Note that the August drop landed right on two widely watched moving averages 20 SMA and 21 EMA. Note that in April – May bears tried to drop under support created by those two upward sloped lines two times but failed. The key rule of engagement in the stock market is “Bears failure to break a support is followed by a new rally driven by inspired bulls”. Trading is a zero sum game. If bears lose then bulls win.
Note how bears failed to break support provided by EMA 21/ SMA 20 weekly in Sep – Oct 2021 and look at the immediate revenge rally to a new all time high that followed:

Now you understand better why this 4,368 level is that important and what is at at stakes here. If bears fail to break under that support bulls can produce a strong revenge rally.
The bearish scenario (i) .
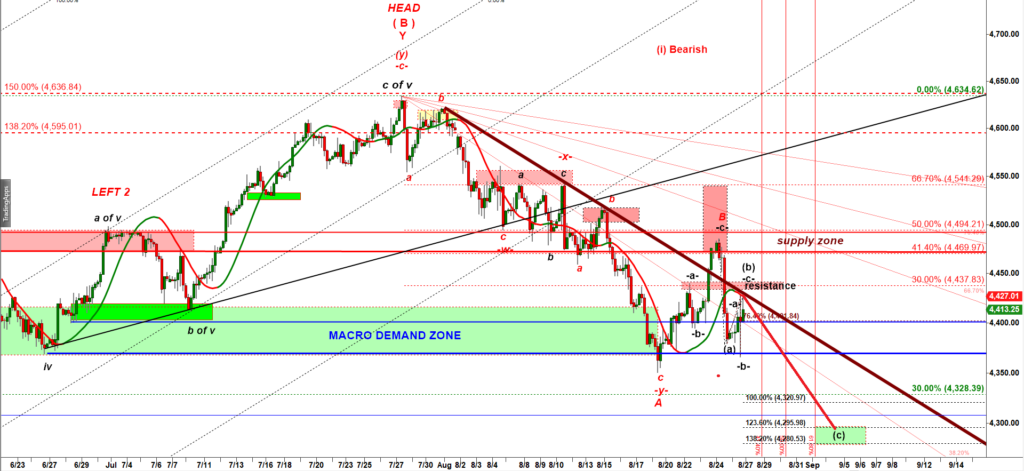
Yes, we got frustrating whipsaw last Friday and price went nowhere. However we have to admit that bears managed to defend the key resistance, the declining dark thick trendline. As long as bears hold ES-mini under 4,440, tat a-b-c up bounce will look like the right shoulder of yet another bearish head and shoulders structure:
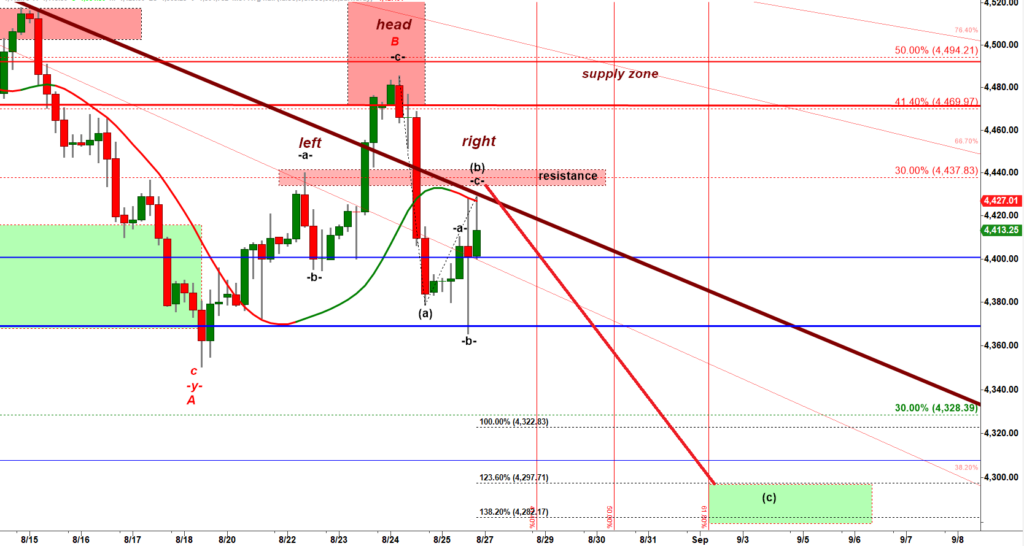
Again, to confirm the bearish scenario bears really need to push ES-mini UNDER 4,368.50, the key support.
(ii) Bullish scenario.
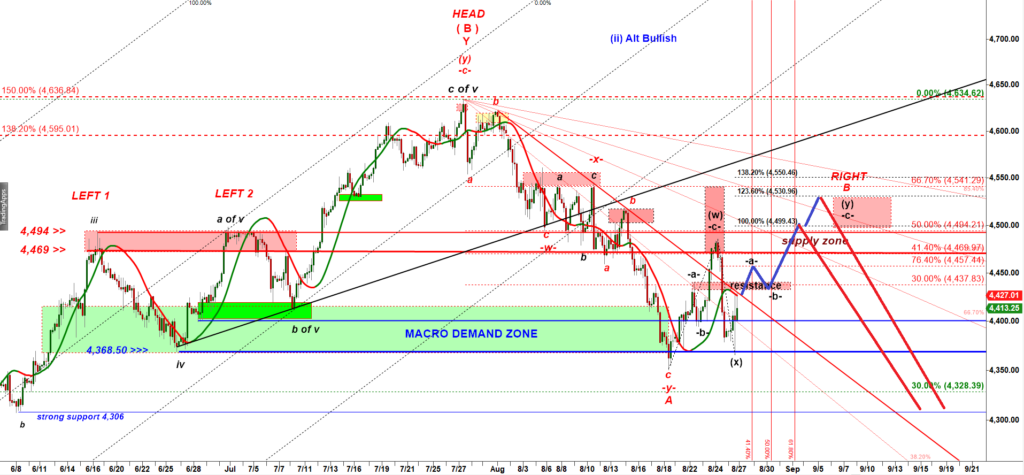
As I explained on Thursday, to trigger that scenario bulls need to get over the red resistance zone at 4,440. The idea behind that scenario is that the right shoulder of the Head and Shoulders pattern should be comparable in size and time to the Left Shoulder. The Left Shoulder was shaped as the double top. The sharp drop we got last week could be counted as a corrective wave (x) down and can be followed by another -a- up, -b- down, -c- up structure of the wave (y) up.
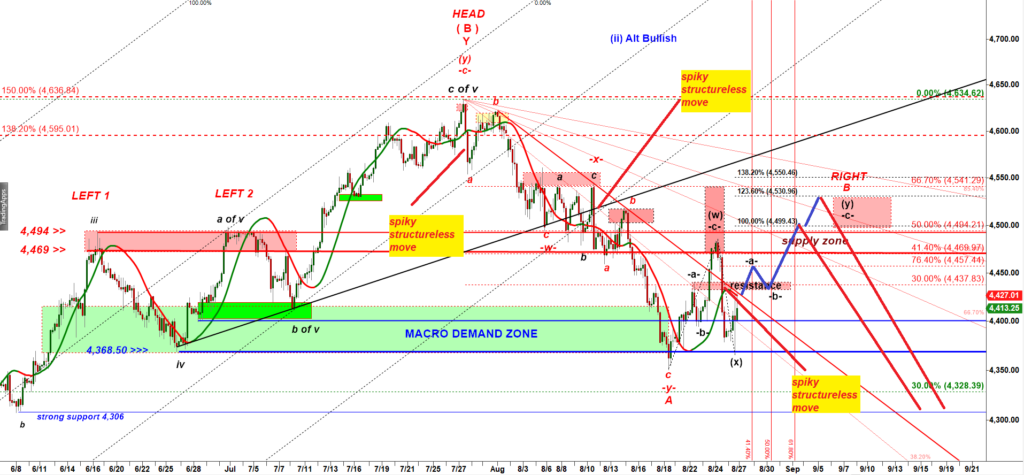
Here you can see why I never trust spiky structureless moves. In majority of cases they do not have follow through but rather are followed with strong pullbacks.
Below is a 30 min SPY chart that also allows bulls to produce another move up:
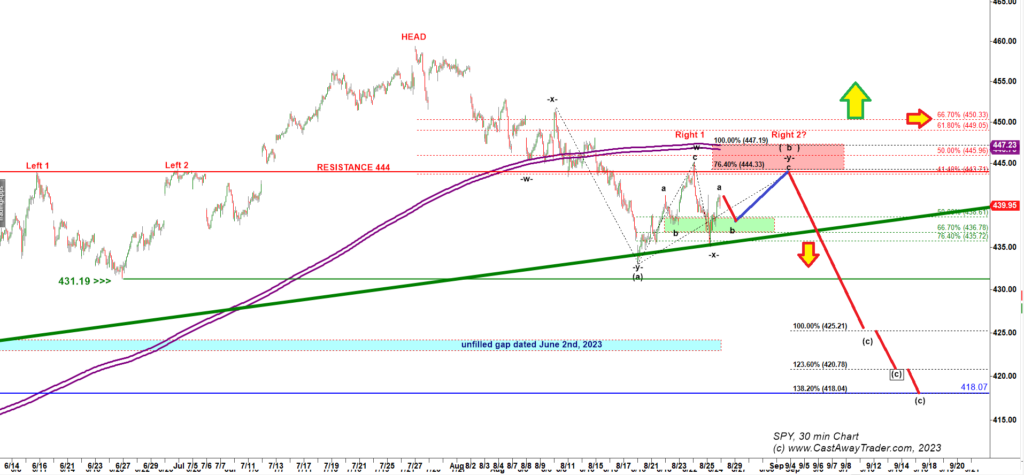
Again, you can see that another push higher to the Red Box would make the Right shoulder look symmetrical in size and time to the Left Shoulder that was shaped as the double top.
However, that bullish scenario is alive as long as bulls hold SPY over the Friday low made at 435.00.
BONUS: VERY BEARISH SCENARIO.
On Friday I shared a very bearish scenario that attempts counting the August decline as an impulsive structure:
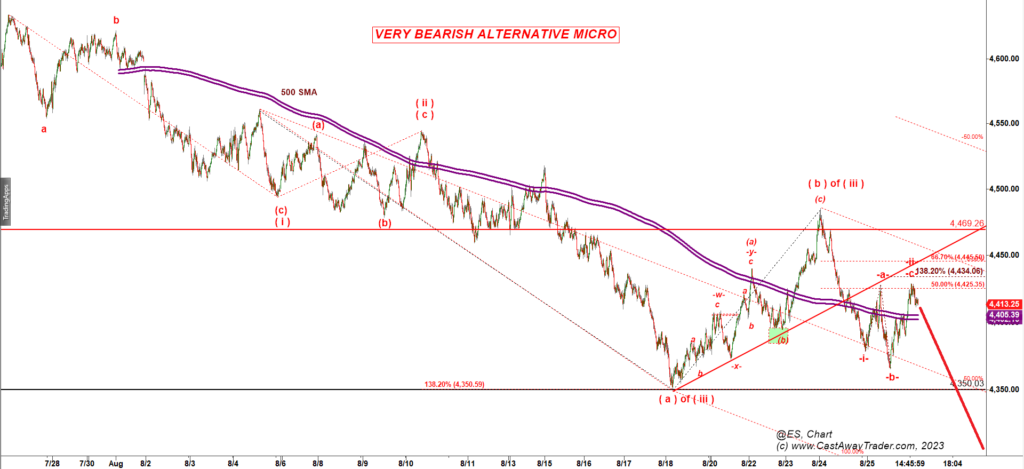
The week ended with a clean bearish -i- down, -ii- up setup, a starting point for the next strong drop in a wave -iii- down:
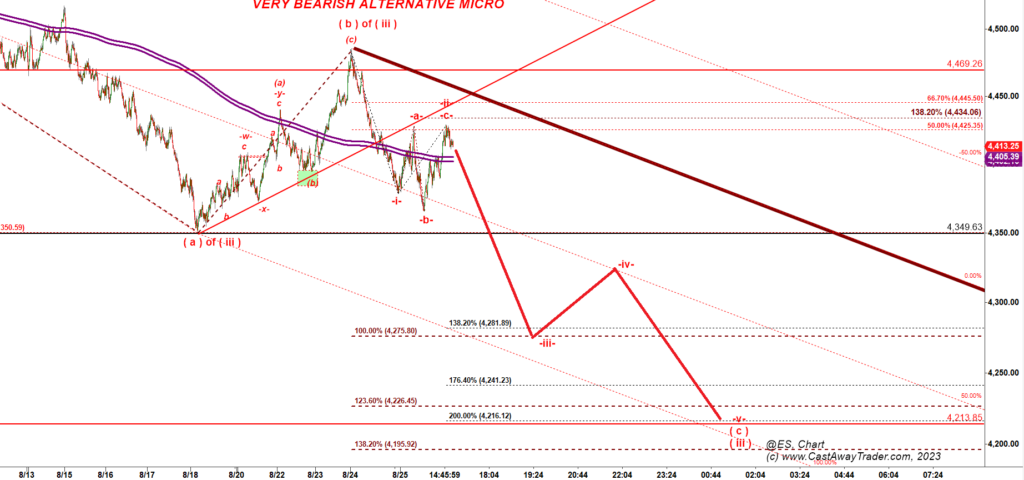
One thing I want you to understand about that type of -i- down, -ii- up setup. The Elliott Wave followers love that type of setups because they provide enormous reward-to-risk ratio. Note that if that setup works well you can make 100 point gain. The stop loss can be places at 4,450. Therefore your risk is 37 points. So your reward-to-risk is about 3-to-1.
The problem is that such high reward-to-risk type of setup has a high price tag. What I mean is that those -i- down, -ii- up setups work out well in 40-45% of cases. You will never get any Elliott Wave guru to admit that.
In conclusion: ES-mini is squeezed in between two strong macro support and resistance levels:
Bears sit on a great short setup. But to trigger that setup the key weekly support 4,368 has to be broken. Until that happens we can see another trip higher first to 4,450 and then to 4,493.
Please consider subscribing if you want to get unlimited access to my daily macro updates with immediate email notifications about new posted reports!