$ES #ES-mini #trading setup #five waves down
Yesterday I shared a bearish path and noted that it would be valid as long as bears keep ES-mini under 4,409:
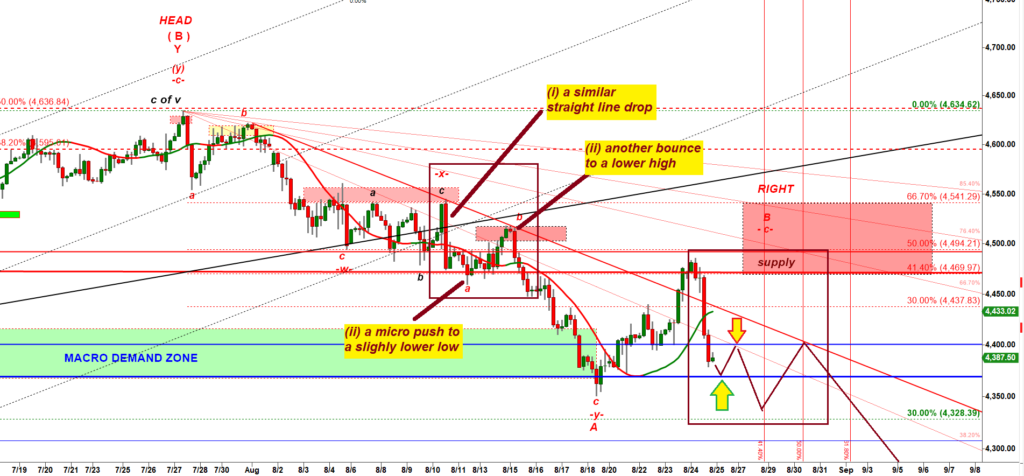
So far ES has been nicely following that path. Note that it dropped down to the point marked up with the green arrow and now is bouncing to the point marked up with the down red arrow. And now I can show you the most bearish scenario:
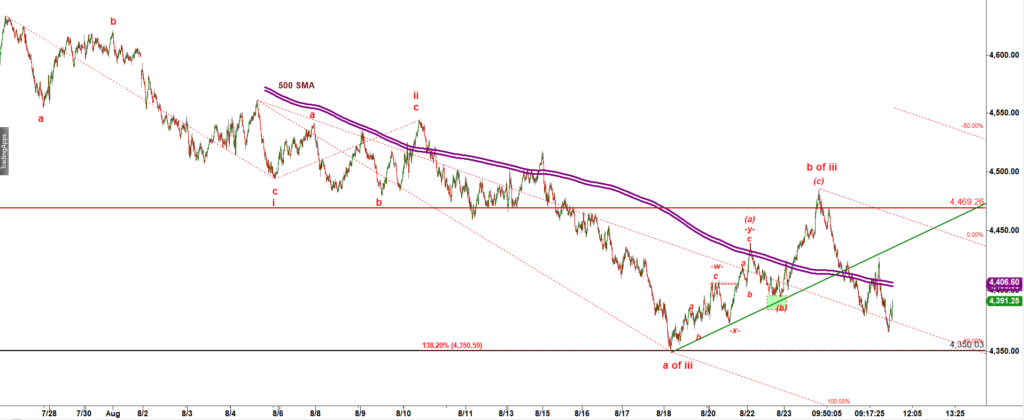
Bears can count that decline off the July top as an unfolding five wave down structure where the strongest part of the decline, a subwave c of wave iii down is about to start.
Under that count ES is starring a very strong drop in a subwave c of wave iii down targeting fisrt 4,275 (a 100% ext of the subwave -a- of wave -iii- down) and then 4,226 – 4,195 (a 123.6% – 138.2% ext of the subwave -a- of wave -iii- down). The second cluster of targets is the destination of the next leg down in a subwave -c- of wave -iii- down.
A trigger for that scenario is a break under the low made last week at 4,350.
If bulls break over 4,409 that would be a warning sign for bears.