$ES #ES #trading setup #breakdown #Elliott Wave
Yesterday I posted a chart showing that ES-mini hit the supply zone:
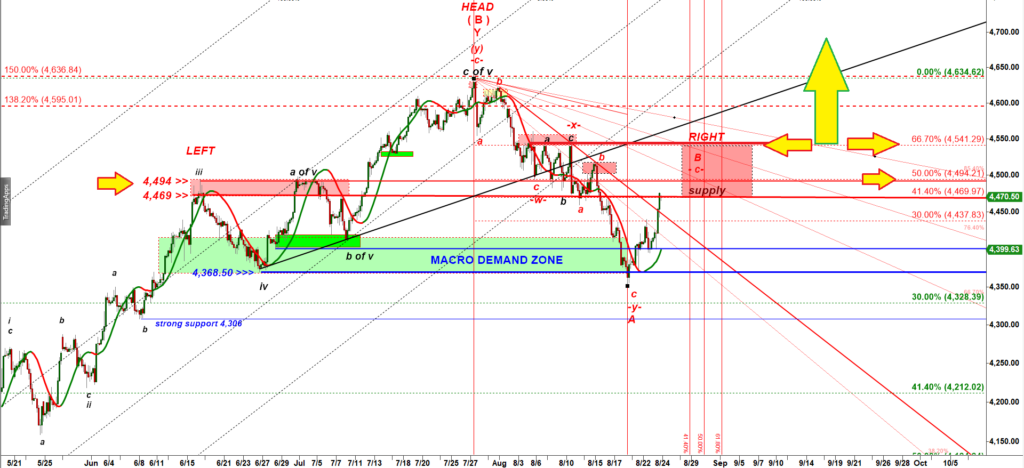
I kept talking about that bearish reversal Head and Shoulders pattern days before the crowd finally took notice.
First I shared expectations for un upcoming bounce on August 17th then on August 21st. My macro expectations remained bearish. I considered that bounce as a pullback that would be followed by another leg down.
Yesterday I noted that bulls would be able to push ES deeper into the red box if they manage to hold an upcoming corrective bounce at 4,440 support:
…“At this point the breakout line at 4,440 is the key support for bulls. As long as they hold ES over that level they can produce another strong leg up.”
We got that 30 point decline down to 4,440 but bulls failed to defend it and that important breakdown triggered a sustained selling that kept pushing price lower until close.
Let’s look at that 240 min chart after this drop:
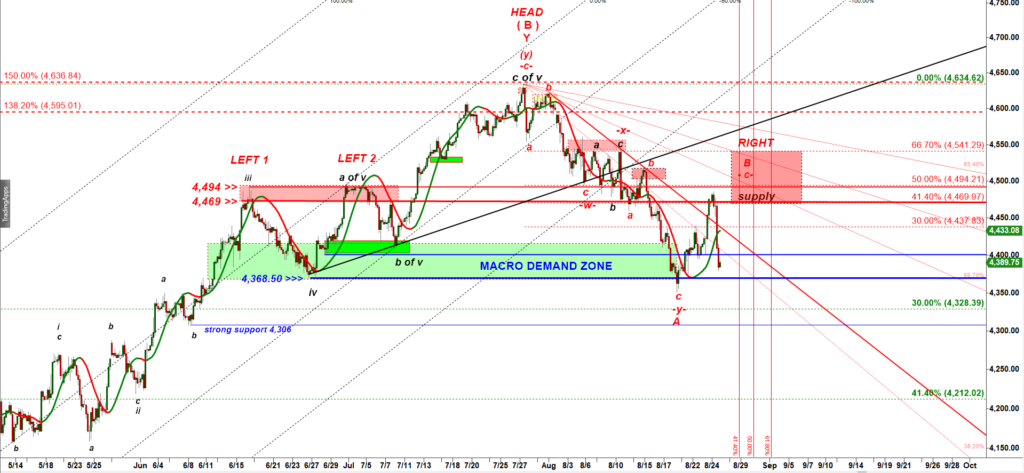
The main question for me is if that three day bounce was all of wave B up or only its subwave (a) up:
The rally perfectly hit the supply zone and turned down. It could be all of wave B up, no doubt about that. The only detail is that the Left Shoulder made a double top and this rally looks a disproportionally small to be the Right Shoulder.
The bearish scenario (i) shown below looks the most reasonable to me:
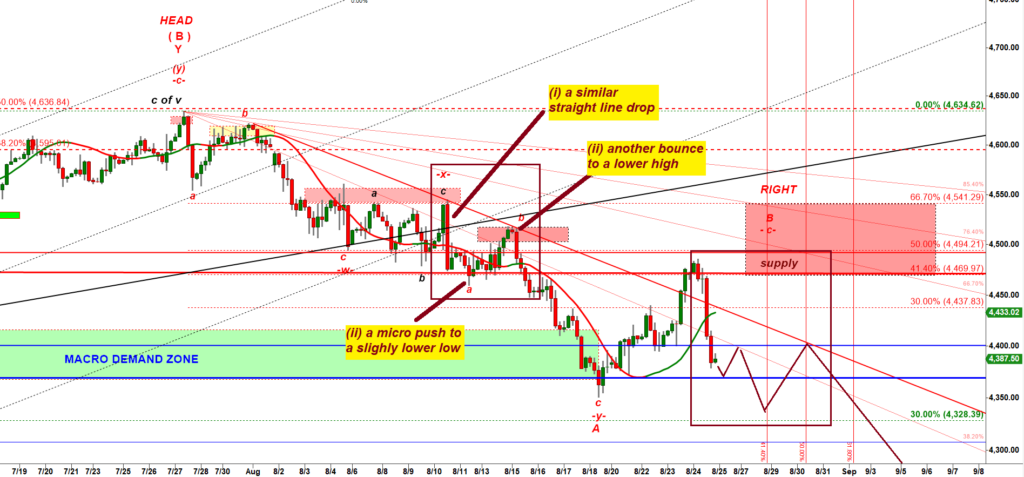
I see a very similar fractal played just two weeks ago (see the upper dark brown box on the chart above). As you can see, under that scenario bulls will not be able to break back over 4,400.
The Daily support is 4,409 for Friday. This level works as a resistance for now. Bulls need to reclaim it to decrease chances for a move down to a lower low. Until bulls manage to push ES over 4,409 the bearish (i) count shown above will remain the primary scenario.
The Secondary support for tomorrow is 4,348.75. ES topped at 4,485.50. Gann’s 180 degrees off that level projects a strong support at 4,352.50. This is where this decline can extend to until we get another bounce up to 4,390 – 4,400…
Now I will show you a lower probability alternative bullish scenario that may materialize if the Chairman Powell sounds bullish tomorrow (which he did not do for months though):
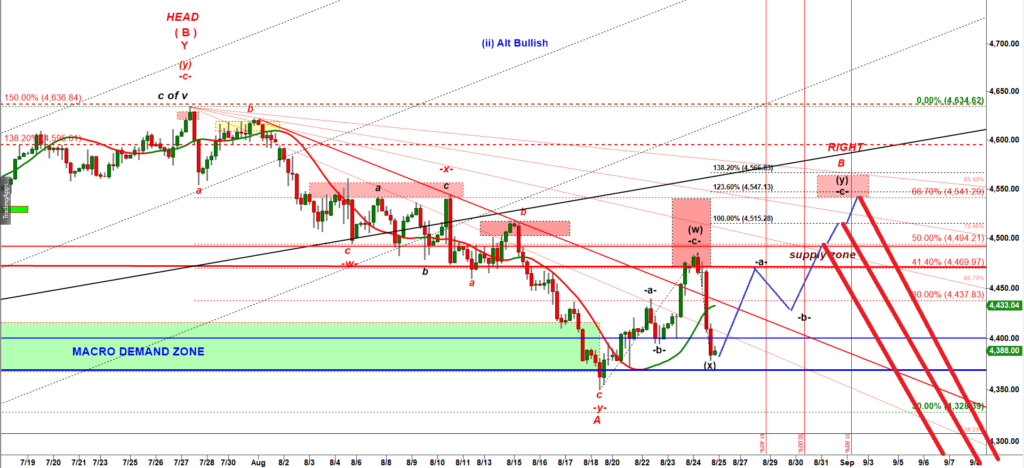
This straight drop we got today could very well be a wave (x) down to be followed by another a-b-c up structure that can at the very least test 4,494 resistance (a 50% retracement fib).
Please note that even if we that miraculous scenario plays out it would just postpone another leg down to 4,260.
BONUS: Daily chart:
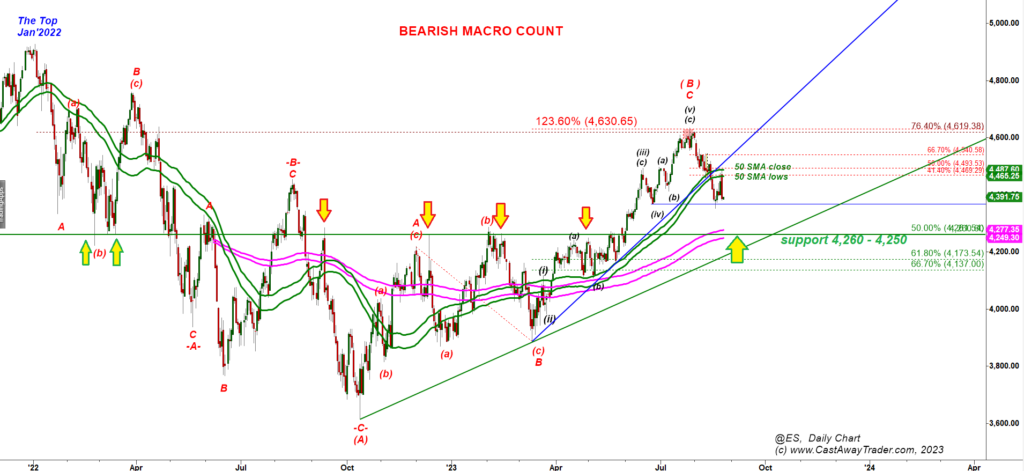
One main takeaway from the Daily chart: “if ES drops under 4,368.50 the next major support will be located 110 points lower, at 4,260 – 4,250”.
On this chart you can see that 4,260 level stopped numerous up and down swings throughout 2022- 2023.