ES: Hit the Target 4,440. That is The Last Line of Bears’ Defense

  • CastAwayTrader
  • June 14, 2023
<<< Back to All Updates
<<< Macro Updates

$ES #ES-mii #trading setup #Elliott Wave #wyckoff #education

In the previous update I shared a bullish path to 4,440. Today ES-mini topped at 4,449.50.

For subscribers of my Premium Chat room I nailed the exact top and turn down:

ES-mini, intraday tick bar chart, posted at 11-21 AM on Jun 14, 2023

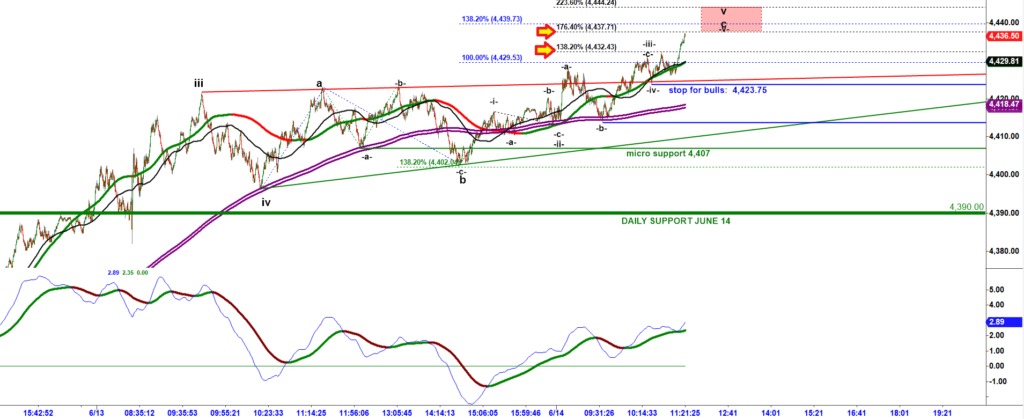
I shared an attractive short setup:

…”break under 4,423.75 would trigger a short “failed breakout” setup.“

Moreover, I correctly predicted the low of the day in my evening update posted on Tuesday in my Premium chat room:

“4,389 should be a strong support, bulls will fight for that level. If they allow bears close ES under that level that would trigger a bearish 2-key reversal: a new higher high followed by an intraday reversal and close under two previous daily closes”.

ES-mini bottomed at 4,383.50 today.

At 2-10 PM EST, right after FOMC announcement, I noted: …”price can easily come back up to 4,420sh to re-test the red trend line”.

And then price rallied from 4,390 to 4,429 in a matter of minutes.

That describes what we are doing in my chat room. It’s a great environment for day traders. But if you are a swing trader you want to now whether we can consider ES-mini having topped.

I really like the Wyckoff Distribution pattern. Because it is perfectly aligned with the Harmonic Elliott wave theory. Moreover, Wyckoff Distribution pattern is just a detailed path for a classic well known Head and Shoulders reversal pattern.

Thanks to that pattern I was able to correctly predict the morning rally, a bearish reversal, the afternoon drop and then a strong corrective bounce around 3 PM EST.

I posted that chart in my Chat room at 8-09 AM EST. As you can see, that pattern argues for bulls to make another push higher. As you know ES-mini rallied to 4,439.50 as that pattern predicted.

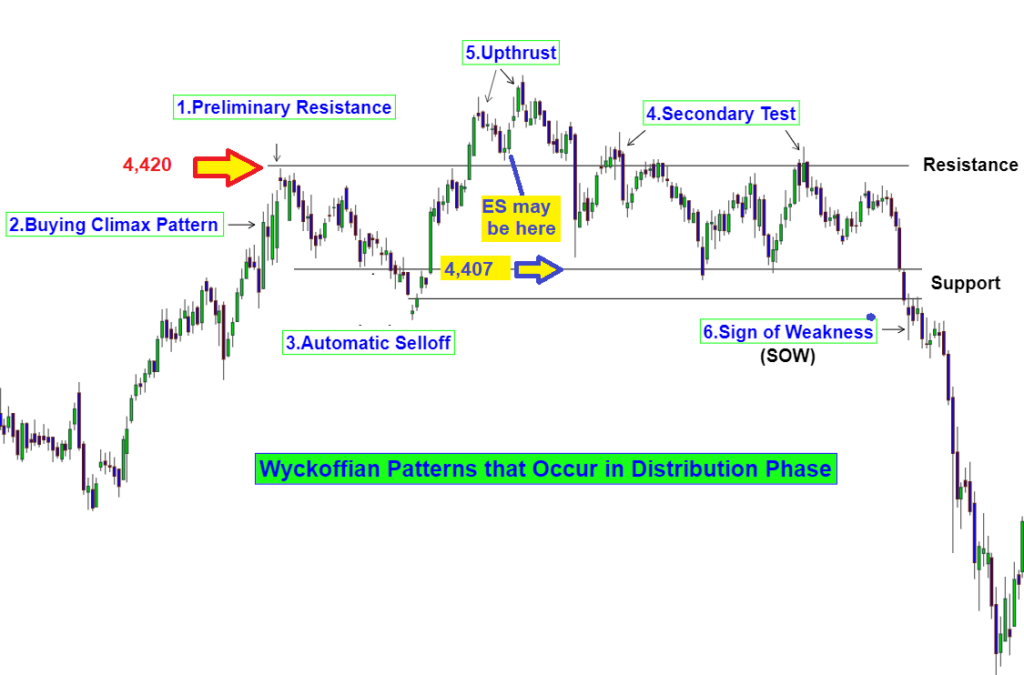
The pattern argued for an upcoming bearish reversal and drop under the high made by the Left Shoulder (4,420). So ES-mini dropped under 4,420.

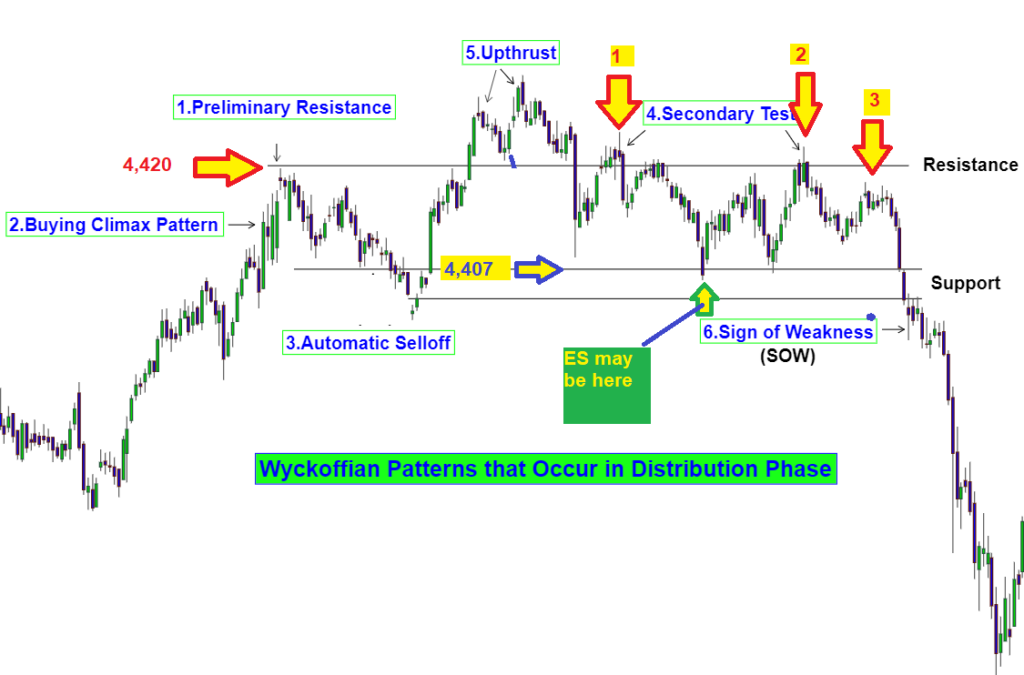
At 2-01 PM EST price dropped and I updated that model aligned with the current location of ES-mini.

That pattern argues for ES-mini to bounce back up to 4,240.

This is where I would place ES-mini here if we use that pattern as our map:

By this moment we have got two consecutive lower highs.

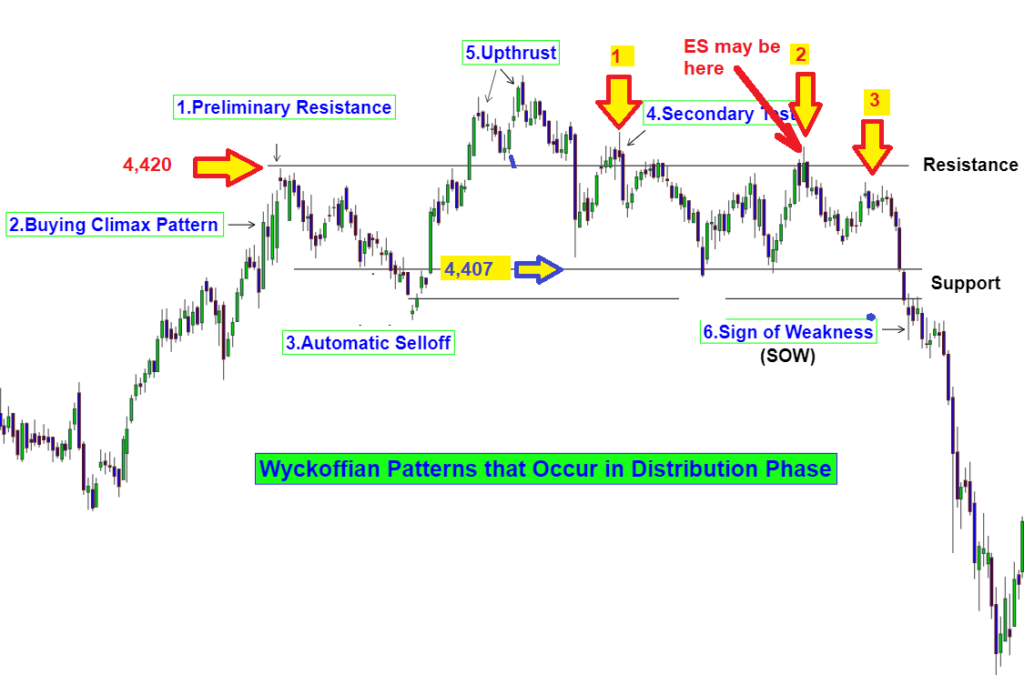
Remember the main rule of a professional short seller:

“acceleration down starts from the third consecutive lower high”.

The Daily Support for ES-mini for overnight and tomorrow is 4,423. This pattern will keep working as out map as long as it holds under 4,423. Please email me if you need more explanation regarding that pattern and the way you can use it in trading.

Please note that 4,389 remains the key support for tomorrow. Bears failed to close a day under support 4,389 support today. But bears have one more day to trigger that bearish 2-close reversal o a daily timeframe. However, do not forget that we are in quad witching OPEX week. And normally we do not get breakouts or breakdown during the last two trading days of an OPEX week.

This is how the bearish scenario looks like:

ES-mini 240 min chart

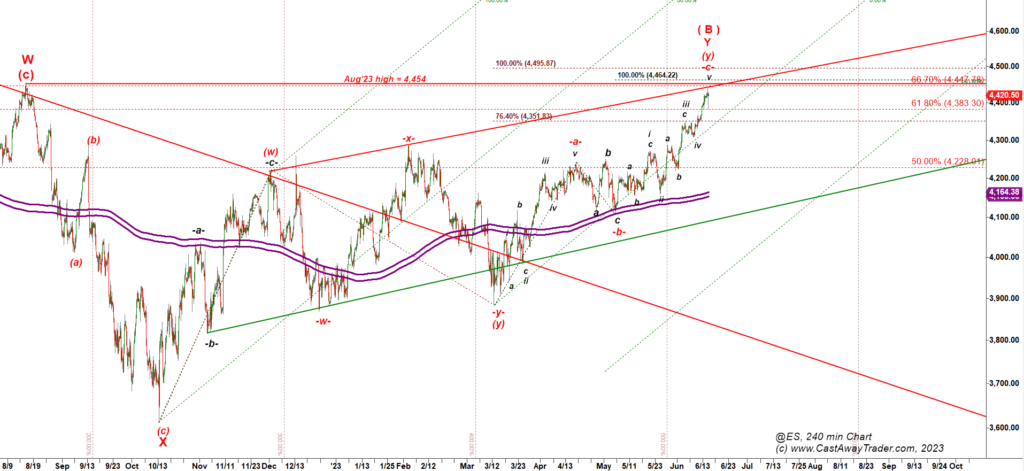
ES-mini approached a very important resistance, a 66.7% retracement of the decline off the Jan’22 top = 4,447.25.

In addition, 4,454 is the previous high made in Aug’22.

Moreover, ES has hit the red trend line that connects two previous highs made in Dec’22 and early Jan’23.

But until bears manage to break under the low made by the previous corrective pullback (4,306) we will not be able to confirm that it has topped.

If bulls manage to break over 4,447, a 66.7% retracement I would have to drop my primary bearish macro scenario that considered that rally as a corrective bounce off the low made in Oct’22. I have to share with you that very different alternative bullish scenario:

ES-mini 240 min, Very Bullish scenario

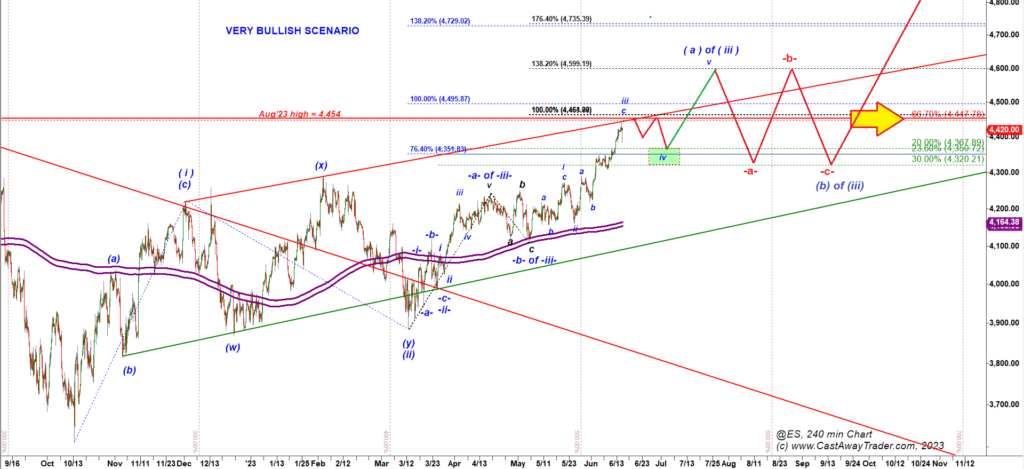
That scenario assumes that ES-mini made a lasting bottom of a corrective pullback in Oct’2022.

Even under that very bullish scenario we can get a pullback off 4,440-4,450 sh but in that case we would get a flat shallow pullback, a consolidation right under the meaningful resistance. That would be just a minor wave iv down to be followed by yet another rally.

If we do not get a strong rejection off 4,440 level like we did in Aug 2022 but rather some “gathering pattern” at the top in a range 4,440 – 4,320, that would be a strong argument in favor of that very bullish scenario. Under that scenario, that consolidation in a wave iv down would be followed by another spiky move up to 4,600 in a micro wave v of (a) of (iii) up. Then we will spend the second part of July – the second part of August in a range market drawing a flat -a- down, -b- up, -c- down structure in between 4,600 and 4,300.

Subscribe to Free Updates

Get Unlimited Access

PrevPreviousNQ: Hit The Target. Has the Big Top Been Made?
NextES: This Leg Up May Hit 4,460 Before A PullbackNext

More To Explore

$BTC: Attractive Breakout Setup in Bitcoin

$BTC $BTCUSD #Bitcoin I am watching an attractive long setup forming before our eyes: BTCUSD 120 min chart I expect

CastAwayTrader July 1, 2025

$SPX: Corrective Pullback is Expected

$SPX #SPX500 Today marks the first trading day of a new month. Let’s see if volatility returns to the market

CastAwayTrader July 1, 2025

Important Disclaimer

CastAway Trader LLC, the publisher of this web-site and videos is not registered as an investment adviser nor a broker/dealer with either the U. S. Securities & Exchange Commission or any state securities regulatory authority. Users of the website www.castawaytrader.com and viewers of the videos are advised that all information presented on the website is solely for informational purposes, is not intended to be used as a personalized investment recommendation, and is not attuned to any specific portfolio or to any user’s particular investment needs or objectives.

Trading stocks, options, or futures carries a high level of risk, and may not be suitable for all investors. Before deciding to trade, you should carefully consider your objectives, financial situation, needs and level of experience. CastAway Trader LLC provides general overview of trading methods that does not take into account your objectives, financial situation or needs. The content of this website must not be construed as personal advice. All trading setups and/or trades presented in the web site and/or trading chat room by CastAway Trader an/or by other members of the chat should be considered hypothetical for educational purposes only and should not be expected to be replicated in a live trading account.

An investor could potentially lose all or more than the initial investment. You should not speculate with capital that you cannot afford to lose. Only risk capital should be used for trading and only those with sufficient risk capital should consider trading. Risk capital is money that can be lost without jeopardizing ones’ financial security or life style.

You should be aware of all the risks associated with trading. You should seek advice from an independent financial advisor.

Any information posted on this web site is not to be construed as an offer to sell or the solicitation of an offer to buy, nor is it to be construed as a recommendation to buy, hold or sell (short or otherwise) any security. All users of the website must determine for themselves what specific investments to make or not make and are urged to consult with their own independent financial advisors with respect to any investment decision. The reader bears responsibility for his/her own investment research and decisions, should seek the advice of a qualified securities professional before making any investment, and investigate and fully understand any and all risks before investing. All opinions, analyses and information posted on the website are based on sources believed to be reliable and written in good faith, but should be independently verified, and no representation or warranty of any kind, express or implied, is made, including but not limited to any representation or warranty concerning accuracy, completeness, correctness, timeliness or appropriateness. In addition, CastAwayTrader LLC and its officers and employees undertake no responsibility to notify such opinions, analyses or information or to keep such opinions, analyses or information current. Also be aware that the owners, officers and employees of the web site www.castawaytrader.com may have long or short positions in securities that may be discussed on the website, Premium Trading Chat room and/or in the videos posted by CastAway Trader LLC.

Past results are not indicative of future profits.

Subscribe to Free Updates

Get Unlimited Access