$NQ #NQ-mini #trading setup
This rally in NQ stretched much higher than I expected. I expected the double brown line (500 MA daily to stop it):
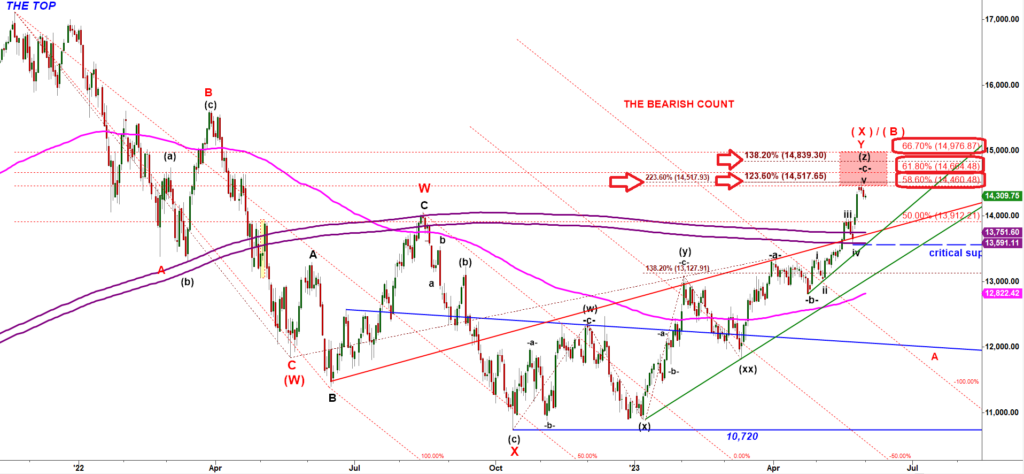
I think we deal with a corrective bounce off the June 2022 low. Despite the fact that NQ made a lower low in October 2022 I would consider it a part of a large corrective W up, X down, Y up structure.
I think we are dealing with a completion of the final subwave Y up of that corrective structure.
Note that NQ stopped at a tight cluster of several fibs:
- 58.6% retracement of the decline off the all time high made in Nov’2021, and
- 223.6% ext of the wave (w) up. The 223.6% ext is the strongest extension in our tool box.
- 123.6% ext of the wave (y) up.
No wonder bulls could not get over that cluster of fibs from the get-go.
The question is whether the major top has been made or bulls could push higher one more time to test the 61.8% retracement fib (14,684) or even 66.7% retracement fib ( 14,976).
Let’s first look at a bullish micro “one-more-high” setup on a 30 min chart below:
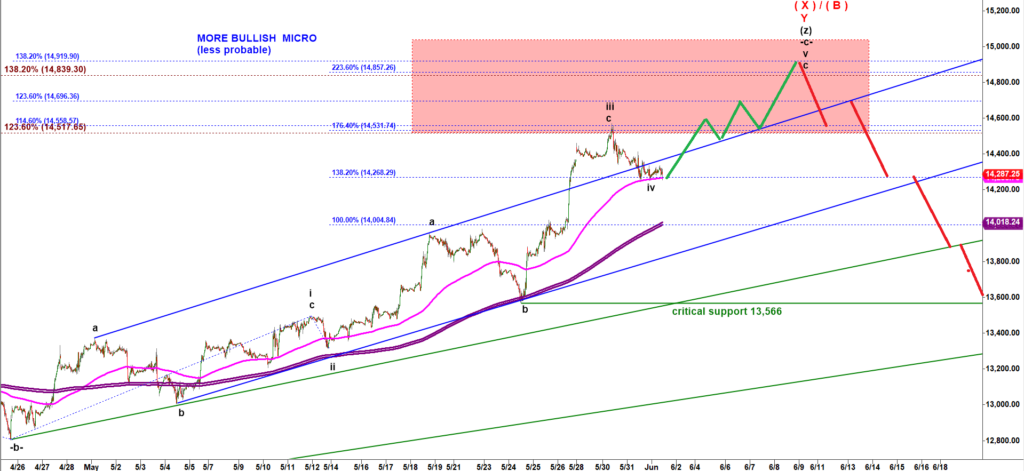
Bulls have a setup to push NQ higher in the final micro wave v up structured as an a-b-c.
Now let’s look at the bearish scenario that argues that NQ made a lasting top already:
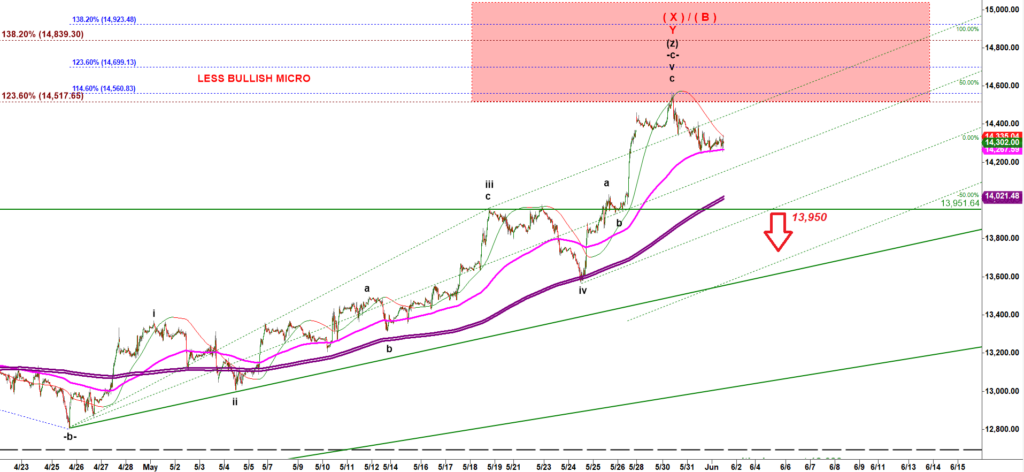
The five wave up rally in NQ off the April’23 can be counted as having topped.
To confirm the completion and a bearish reversal bears need to violate the critical, support at 13,950.