$ES #ES-mini #trading setup
Remember, a 66.7% retracement is the strongest retracement fib you should always pay attention to. In this report I will show you how that retracement fib can define the path for ES-mini for the following two weeks.
(1) The Least Bullish scenario. Let’s start the weekend update from my primary wave count:
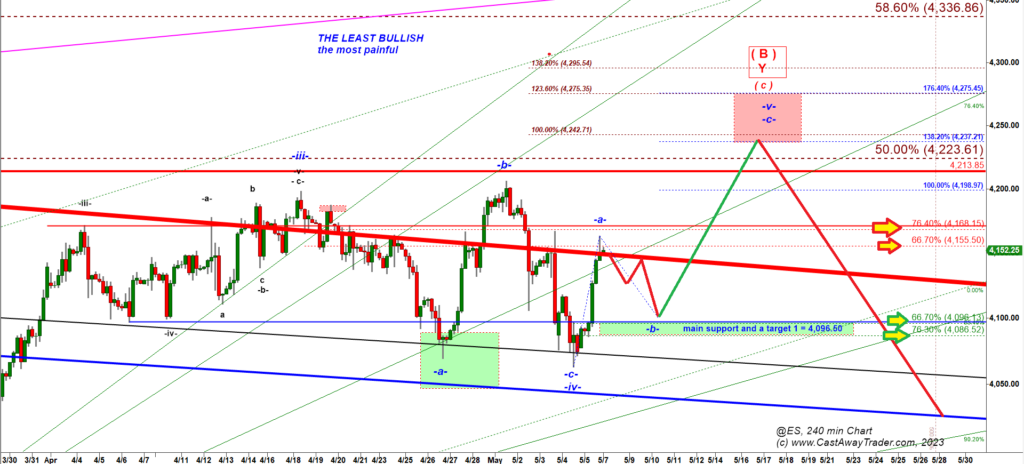
Under that scenario ES completed a large corrective wave -iv- down last week and started the final move up in the wave -v-. The good thing is that the final wave -v- up in 90% of cases has a clean -a- up, -b- down, -c- up subdivision. The bad news is that the top of its subwave -a- up is barely predictable. Sometimes it goes up non-stop until it hits the high made by wave -iii- down and turns down making a double top. But there are plenty of cases where the subwave -a- of wave -v- up stops at 76.4% or 66.7% retracement of the preceding decline of the wave -iv- down. In that case, that first push up off the low made by wave -iv- down is followed by a deep a-b-c down retracement of subwave -b- down of wave -v- up. That subwave -b- down of the wave -v- up may retrace 66.7% – 76.4% of the rally in subwave -a- of wave -v- up (see the green arrows on the chart above). Under that wave count bulls could push ES higher to 4,168, 76.4% retracement of the preceding decline.
(2) The Very Bullish Scenario.
The red a-b-c down structure could be counted as a wave -b- down (instead of a micro wave -iv- down as in the Scenario 1).
The very bullish scenario allows bulls to produce a strong three or five wave up in a subwave -c- of wave ( y) up that can climb up to 4,340 – 4,420 and even higher. But by now it hit strong resistance of the Red Thick declining trend line and the 66.7% retracement of the preceding decline ( 4,156.75).
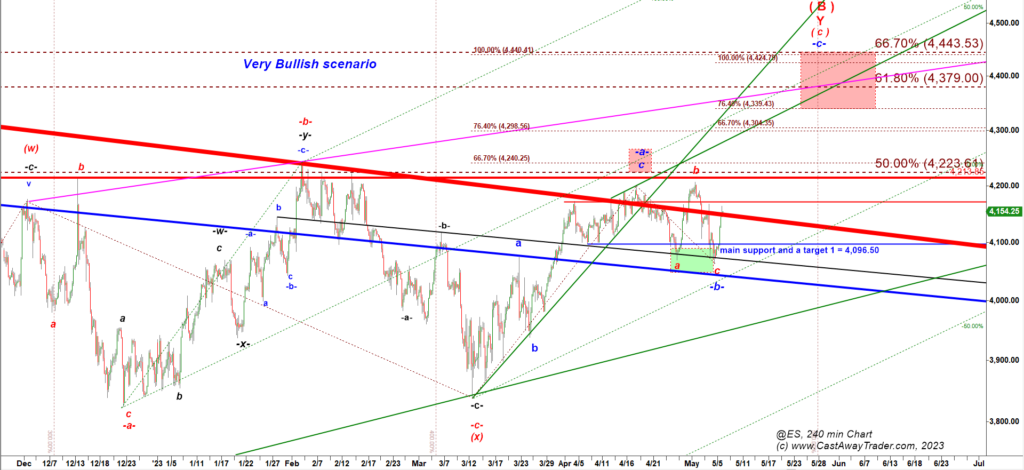
Under the Very Bullish count bulls can keep pushing higher.
To solidly confirm that count bulls have to push ES over 4,168, the 76.4% retracement of the preceding decline (the thin red horizontal line on the chart above). The next resistance will be 4,206.50, the Monthly Resistance for May.
(3) Alternative Bearish scenario.
The average seasonality for SPX shows bearish pattern for the following two weeks of May:
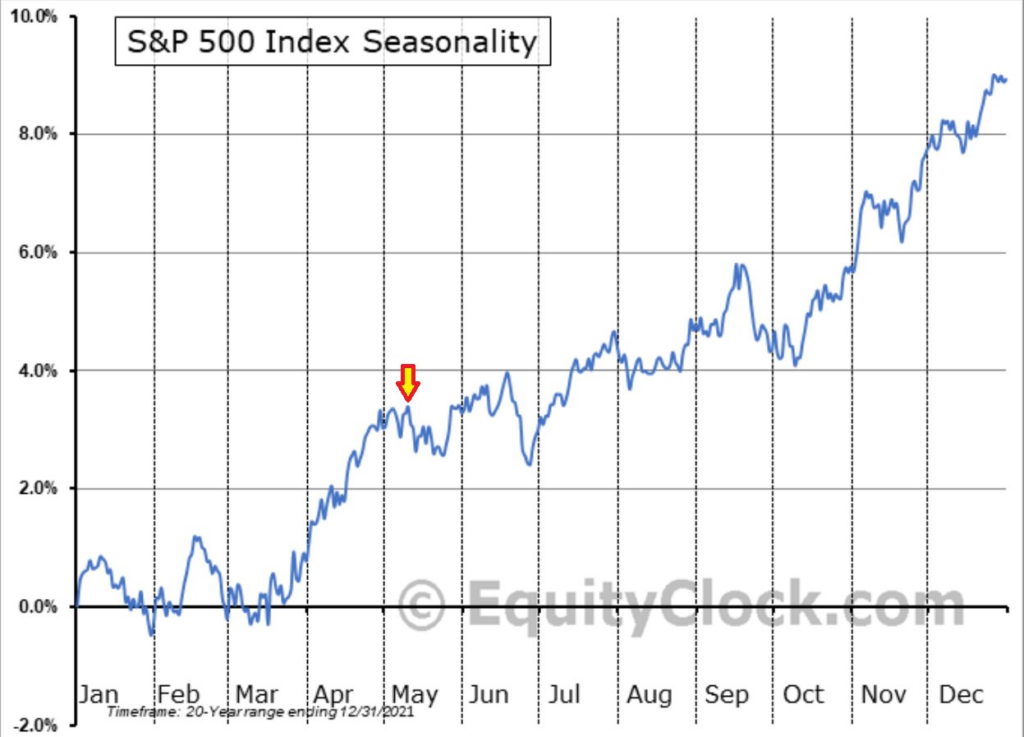
Because of bearish seasonality for at least next two May weeks I will show below an alternative bearish scenario.
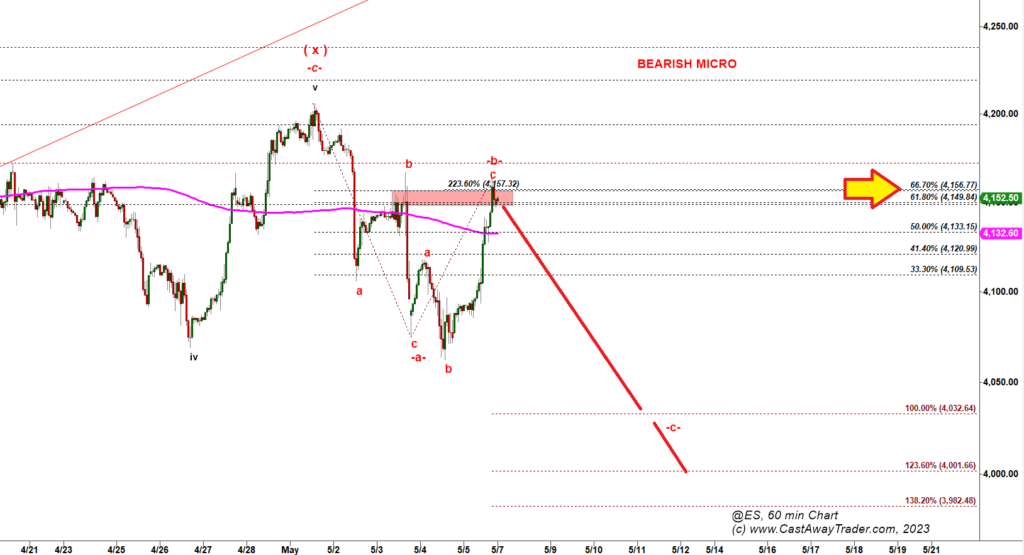
The critical resistance for the bearish scenario is 66.7% retracement of the preceding decline = 4,156.75. Bulls failed to break over that level on Friday. If Bulls fail to get over that level during the next 24 hours that scenario will have good chances to play out.
That wave count allows bears to produce a strong move down targeting first 4,035, the Yearly Support with potential extension down to 4,000-3,980.
To invalidate that bearish scenario bulls need to push ES over 4,156.75.