$ES #ES-mini futures
In my Sunday update I noted:
The last week produced the narrowest weekly trading range for several months. When an extended move is followed by a doji candle with the narrowest range for 8-10 bars that almost always leads to spike in volatility. The rule of thumb for any trader is: “Contraction in Volatility Always Often Leads to Expansion in Volatility”.
And we got a nice spike in volatility today. The trading range was the highest one for the last nine trading sessions.
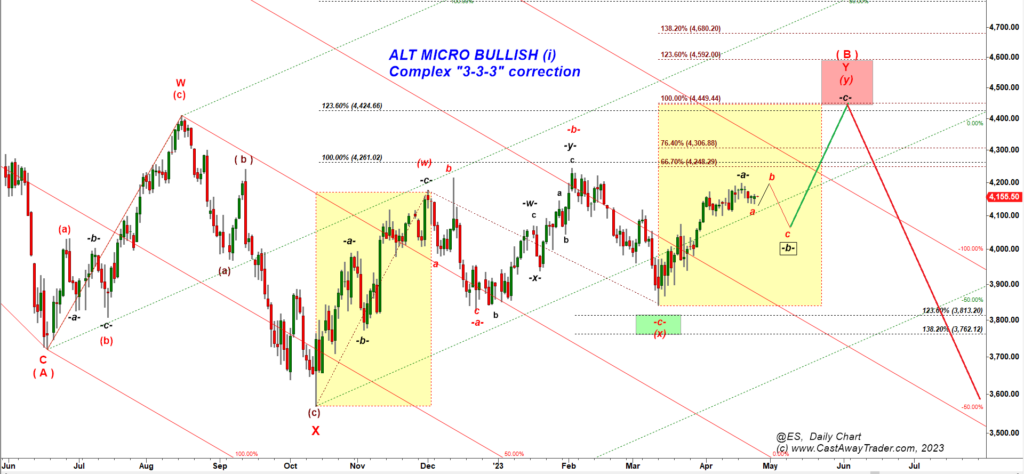
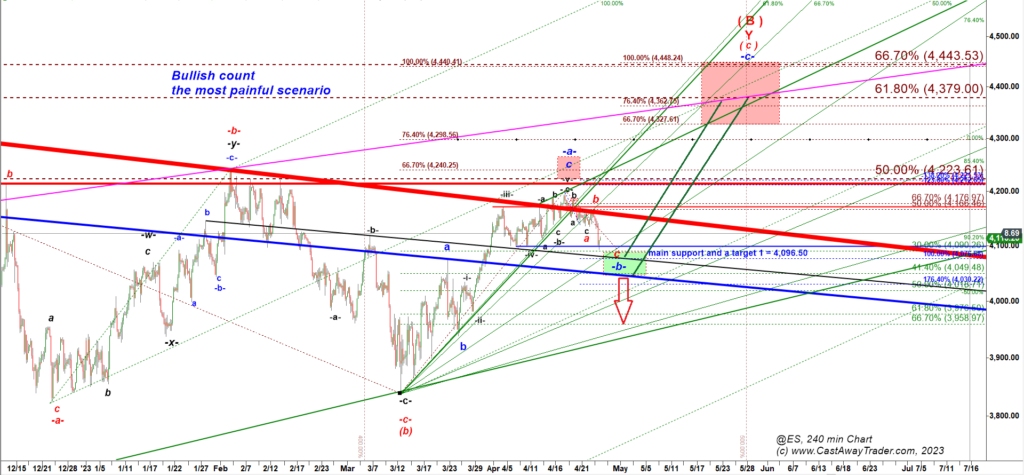
This decline fits the bullish scenario we discussed in the update posted yesterday:
This is how that chart looks like after the Tuesday decline:
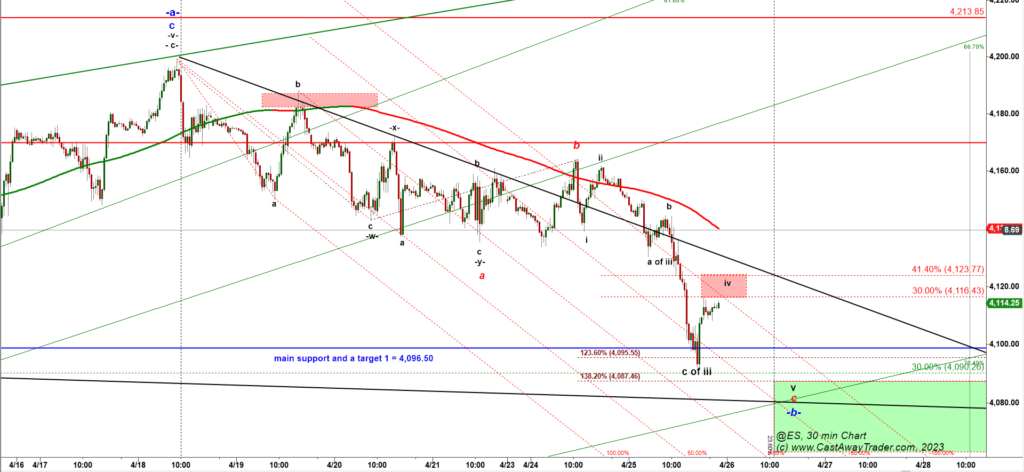
So far ES slid down in an a-b-c corrective looking structure. The first support and the target 1 for this decline was 4,096 and it got tested on Tuesday. If we zoom-in we will clearly see that a-b-c down structure:
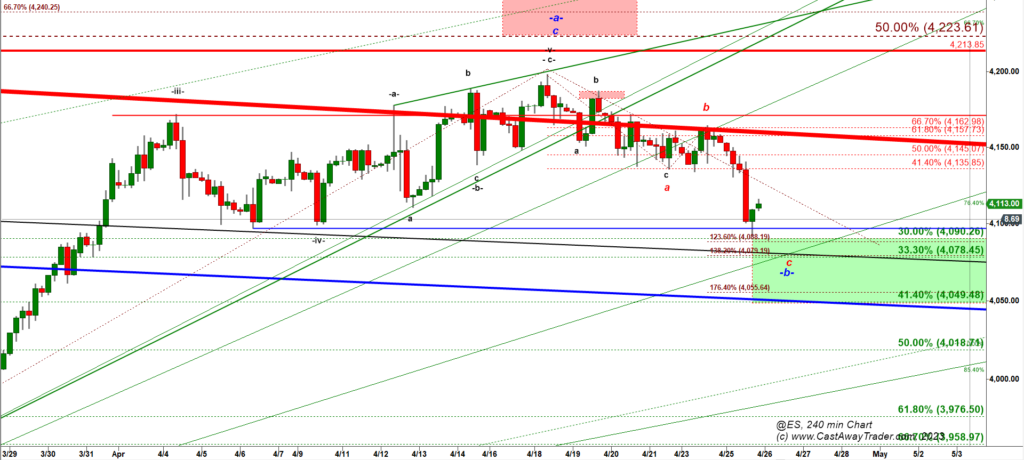
Today ES hit a strong confluence of two fibs:
30% retracement of the preceding rally and 123.6% ext of the red subwave b down.
Not only that but ES re-tested the low made by the previous corrective decline in a wave iv down of one degree lower, the textbook target 1 for a pullback.
Bears can push ES-mini lower to the next strong confluence of fibs located at 4,078:
- 33.3% retracement of the preceding rally and
- 138.2% ext of the red subwave a down.
That would be the ideal spot for bulls to stop the leakage and turn it back up for a new large leg up in a wave -c-.
That is a setup for one more drop to 4,078:
If bulls fail to turn ES back up off 4,078 that would be a very bearish signal that we may be dealing with a correction of much bigger degree.
4,139 is the Daily Support-turned-resistance for the overnight session and Wednesday. Bears will be in control as long as they hold ES under that level. Break over 4,139 after 9-30 AM would confirm that this pullback is completed and significantly diminish chances for one more push lower.