$ES #macro #trading setup
In my previous update I shared a path for a rally from 4,075 to 4,250. In one day bulls made a strong rally that covered significant part of that trip:
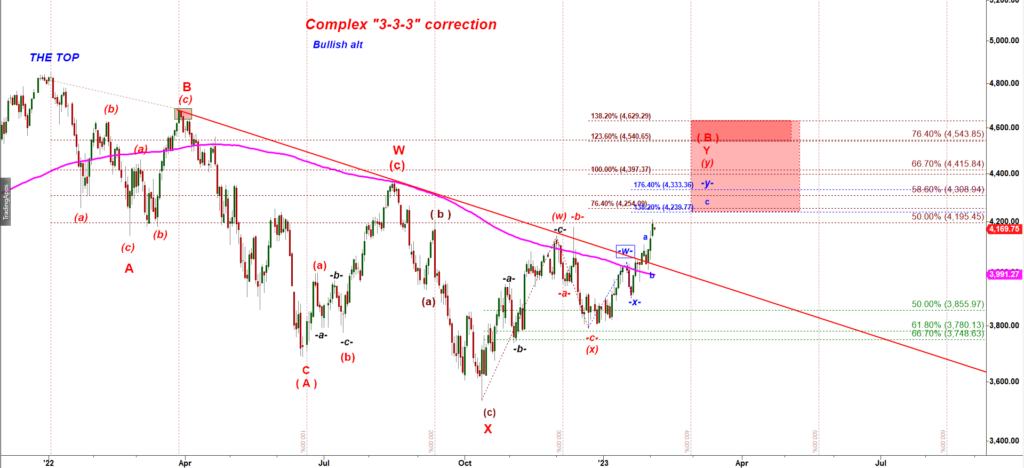
The main idea behind that wave count is that we deal with a large corrective bounce off the October 2022 low labelled as (w) up, (x) down, (y) up.
The minimum required target for the second leg up labelled as (y) is 76.4% extension of the first leg up labelled as a wave (w) up = 4,254.

Note that 4,172 – 4,155 is a very strong price level:
That is a confluence of (i) Gann’s 270 degrees down off the Jan’22 top, and (ii) 50% retracement of the 2022 decline and (iii) a level that stopped several down swings and up swings over the last 12 months.
If we zoom-in we will see that the wave (y) up is subdivided into three waves, -w- up, -x- down and -y- up:
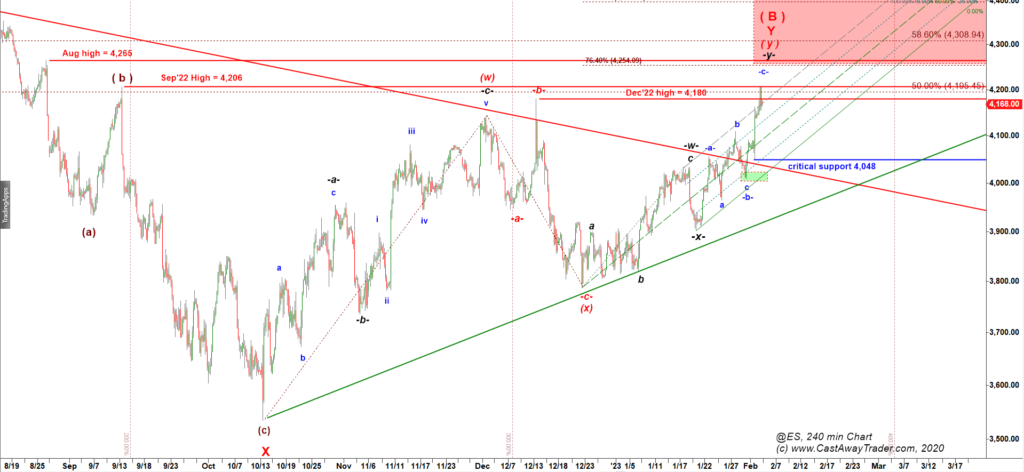
On that chart you can see that the structure of the rally may be completed by 99%. We got a clean a-b-c up move inside subwave -y- of wave (y) of B up. Today ES spiked over the December 2022 high but got faded in the afternoon triggering “failed breakout” short setup.
If we zoom-in to 30 min chart we can see that as long as bulls hold ES-mini over 4,154 they can push ES higher one more time to tag the Green Target box:

In conclusion: we can see that the structure of the corrective rally is 99% complete. From here risks of a breakdown becomes elevated and any quick long trades may turn into underwater “investments”.
I expect the market to turn down in a matter of days and start a new leg down. The first support/ target is 4,035.