#ES #SPX #Elliott Wave
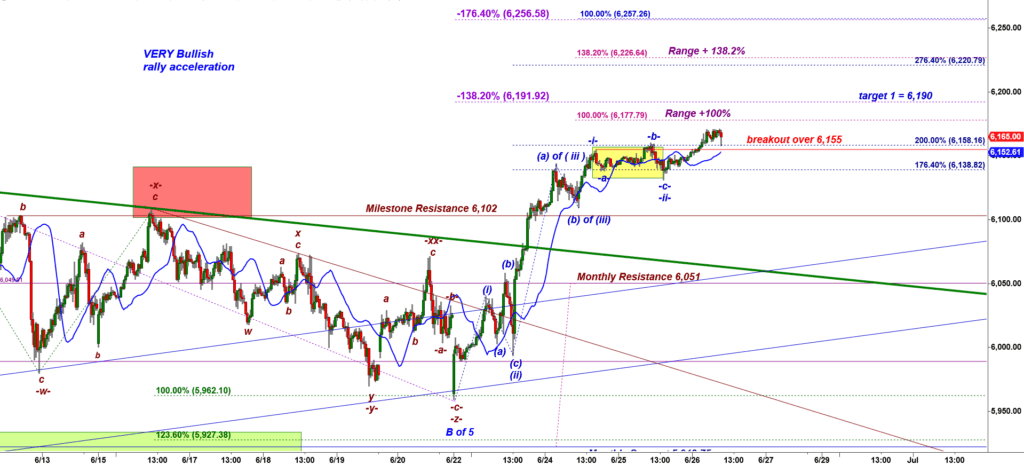
yesterday we noted a complete looking shallow and flat -a-b-c- down consolidation:
…that is a very shallow bullish looking consolidation. Now a break back over 6,155 would trigger a rally up to 6,256…
ES-mini 30 min chart
I highlighted that -a-b-c- down pattern with the yellow rectangle. When a strong impulsive wave up is followed by that kind of a consolidation at the top more often than not bulls make another push higher off that newly built base. Under the Very Very bullish scenario bulls can keep pushing ES higher non-stop for another 100 points
Overnight bulls broke over that immediate resistance 6,155.
What gift bulls got from Fed yesterday:
The Federal Reserve just proposed lowering capital requirements for the biggest U.S. banks (like JPMorgan and Goldman Sachs). This move gives those banks more balance sheet room to: Hold more Treasuries Make more loans Take on more risk (including in equities and derivatives)
Why it’s bullish: This functions like a liquidity injection without actual money printing. By freeing up potentially $200B+, the Fed is encouraging more leverage and market activity — which historically fuels rallies, especially in risk assets.
Bottom line: Lower capital buffers = more risk-taking. More risk-taking = more fuel for the ongoing rally. This aligns perfectly with the Very Very Bullish case I laid out today.
Those news are super bullish. But the market has already priced in some good news. And normally there is a 60 -70 day lag between of liquidity expansion event and actual rally in the stock market.
Remember one rule of thumb: the most bullish “no-brainer” type of good news always arrive when the market approaches some peak.
Part 2. LESS BULLISH TOPPING Scenario.
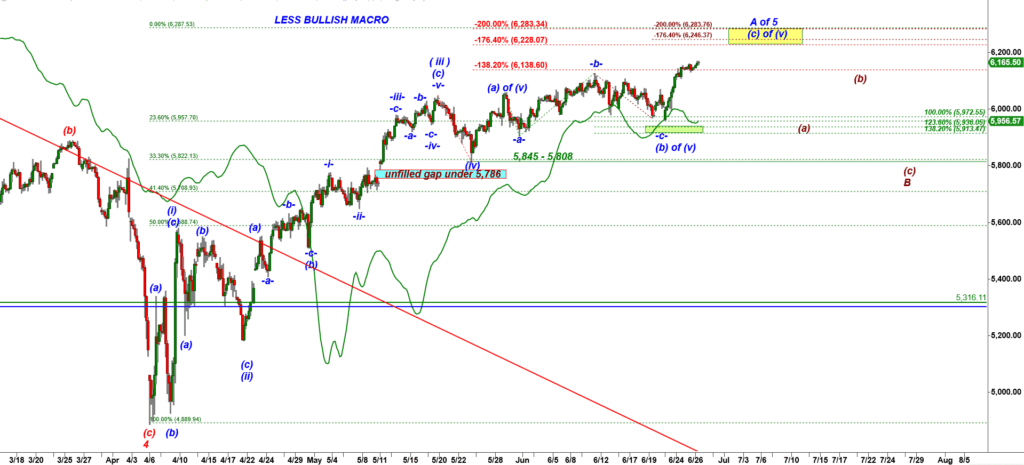
Yesterday I shared a similar wave count for SPX (cash index of S&P 500):
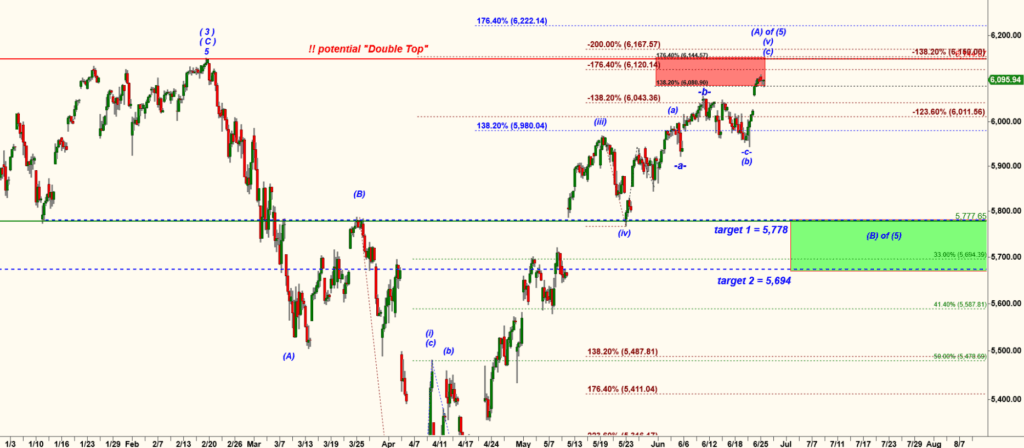
S&P Cash Index, Daily chart
This wave count considers the rally off the April’25 low as a 98% completed structure.
That mid-term bearish scenario supports two key ideas:
“Buy the rumor, sell the news” — It’s almost certain that many investors were aware of the upcoming bullish news about easing capital requirements and positioned themselves accordingly by buying stocks in advance. The market may get into the profit-taking phase following that run-up. Liquidity effects are delayed — Historically, there is often a 60-day lag between liquidity expansion measures and a sustained bullish move in the market. Under this bearish scenario, we could see a boring (a)-(b)-(c) down correction unfolding as subwave B, which would take the form of a range-bound consolidation between 6,300 and 5,800 before any renewed rally begins.
The next leg up in a subwave C of wave 5 up may come as the textbook final blow-off top rally that can propel S&P up to 7,500 – 8,000.