$ES: Macro Weekend Update: Bulls Can Produce One More Leg Up

  • CastAwayTrader
  • October 15, 2023
<<< Back to All Updates
<<< Macro Updates

$ES #ES #trading setup #Elliott Wave

The Primary Bearish scenario allows bulls to make one more push lower to produce a clean (a)-(b)-(c) up corrective structure off the early October low.

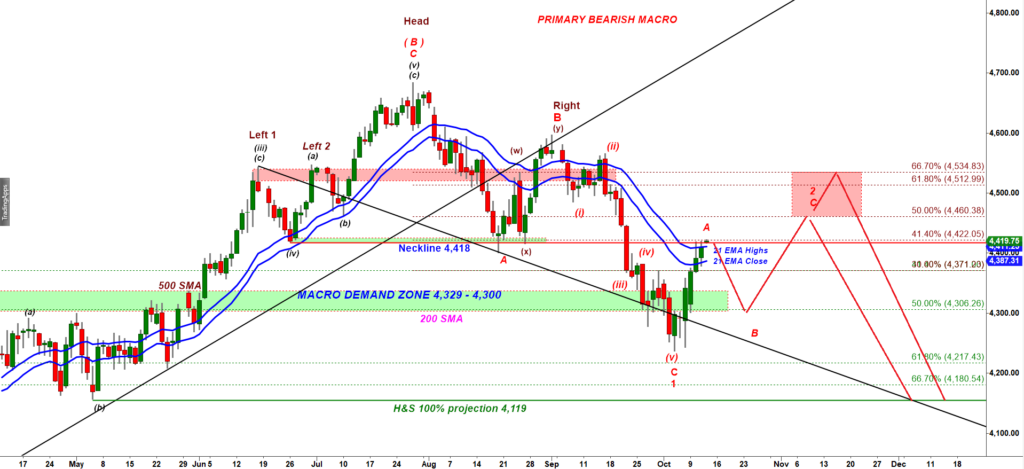
This is how that scenario looked like as of last Sunday:

ES-mini Daily chart posted on Oct 8, 2023

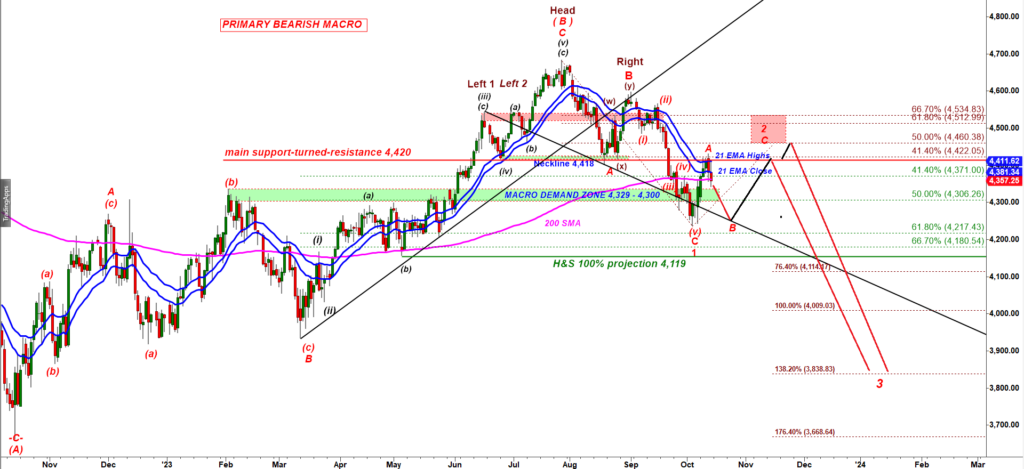
This is how that scenario looks now:

ES-mini Daily chart

Let’s zoom in to a 120 min chart and see how that bearish path may play out:

ES-mini 120 min chart

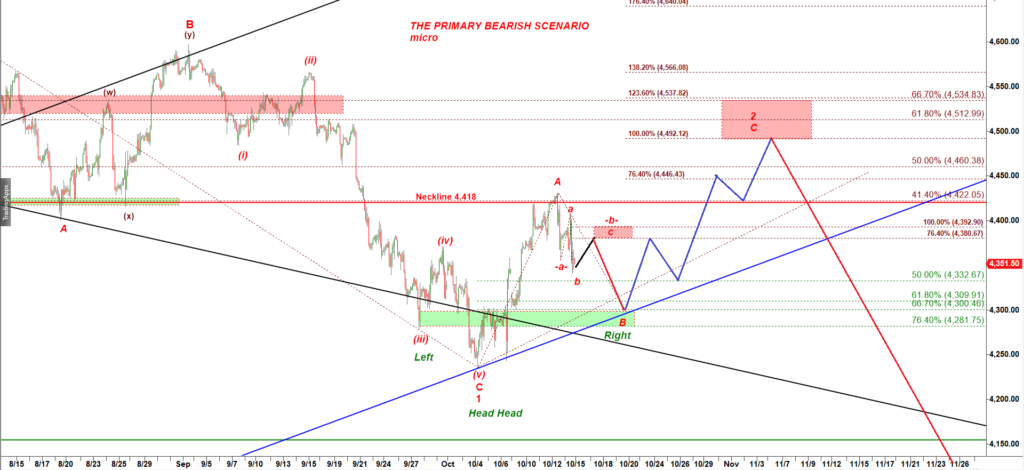
On this chart we can see three potentail attractive trading setups.

Here we move from theory to practice. We say, let’s imagine the future takes this path. How we gonna make money on that bearish path?

Potential setup 1 (short).

If we get a bounce up to 4,380 and then rally stalls at that level, that would be a great short.

Potential setup 2 (long).

If we get an -a-b-c- down move to tag the Green Box and bull stop it at or over 4,280 that would be a very attractive long setup to ride the second leg up in a wave C up targeting the Red Box.

Potential setup 3 (short).

If price make a five wave up rally that stops at or in the red box we can go short to ride a very strong decline in a wave 3 down targeting 4,050 wit potential extension to 3,800 (to retest the Oct’22 low).

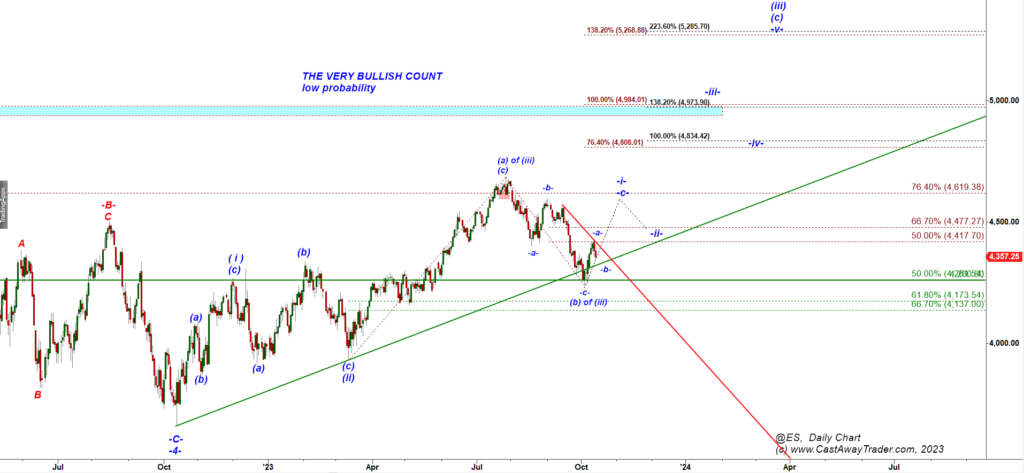
Let’s now come back to the Bullish Macro Scenario now.

First I will show you a chart of S&P cash index (SPX):

S&P 500 index, daily chart

Below you can see how that same scenario looks like on ES-mini Daily chart:

ES-mini Daily chart

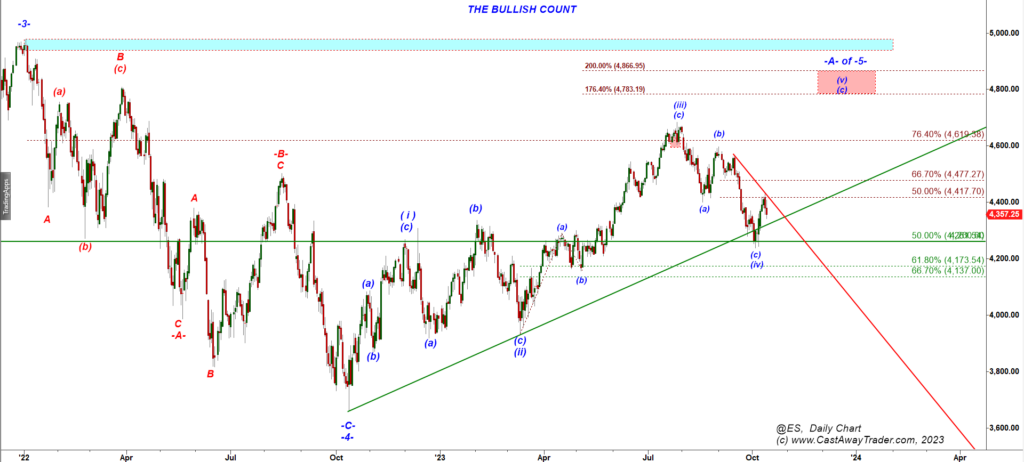
Frankly, I am skeptical about that wave count because wave (iii) up failed to tag the min required 138.2% ext of the wave ( i) up. However, bulls can argue that the July top was only a subwave (a) of wave ( iii ) up and the a-b-c pullback that followed was a subwave (b) down. That could be considered an alternative Very Bullish count that allows bulls to start a very strong rally in a subwave (c) of wave ( iii ) up targeting to re-test the all time high made in Jan’2022.

That Very Bullish scenario looks like that:

ES-mini Daily chart

The -a-b-c move down off the July high can easily be counted as a corrective pullback.

That corrective pullback allows bulls to start a new stronger leg up.

We can dive in even deeper and outline how that bullish scenario can make the next move based on a micro tick bar chart:

Bullish Micro scenario (i):

ES-mini, tick bar chart

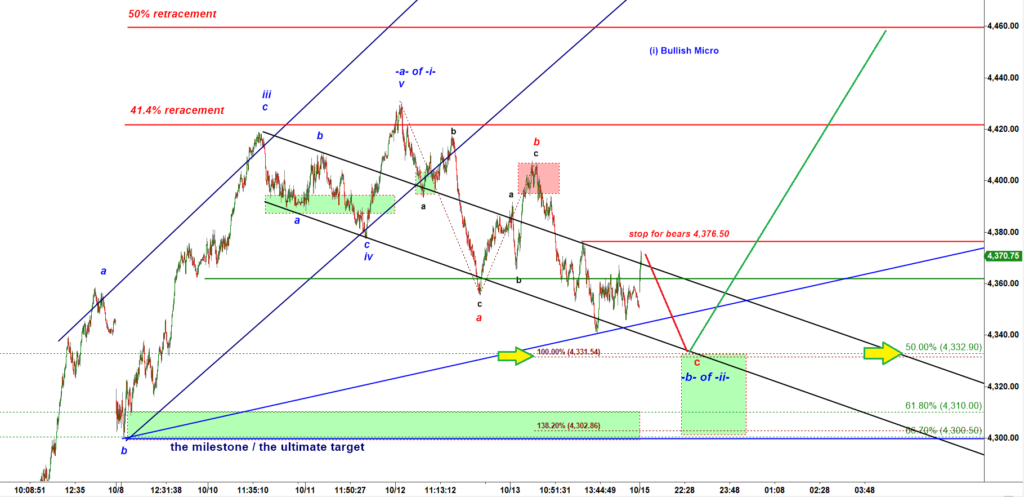
We can count the move up off the Oct low as a five wave up rally and count it as a subwave -a- up.

That rally should be followed by a three wave a-b-c down move or a complex w-x-y decline.

In case its a simple a-b-c down the wave -b- down may bottom at 4,332 at 100% ext of the wave a down.

Bullish Micro scenario (ii):

We can count the October decline as a complex w-x-y structure:

ES-mini tick bar chart

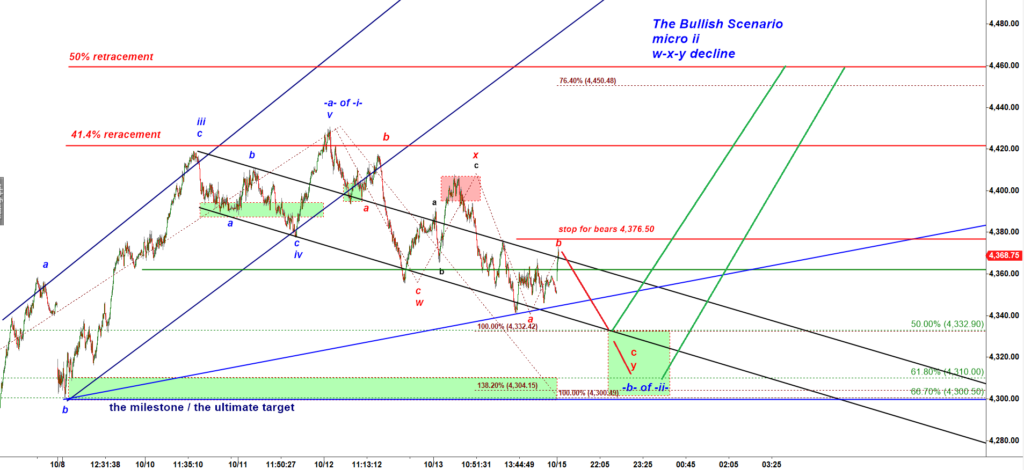
the decline may extend lower down to 4,300.

No doubt, if we get such an emotional drop to 4,300 that would be much better long entry because it would test much stronger support, the low made by the subwave b down. That drop would provide bulls with a setup to test a 50% retracement of the preceding decline = 4,460. But it will be able to extend all the way up to 4,575 (see the location of -c- of -i- up on that Daily chart posted above.

So, under the Bullish scenario we can conclude that:

(i) bulls can start a nice push higher after bears test and fail either at 4,332 or 4,300.

(ii) break over 4,376.50 would confirm start of a new rally.

Now I want to remind you that when we discussed the Macro Bearish scenario above I outlined the first short setup: “if we get a bounce up to 4,380 and then rally stalls at that level, that would be a great short.”

This is a perfect case that shows that even when you have several conflicting scenarios you can find trading setups when two very different scenarios allow bulls or bears to make a move in one direction. This is when its a good time to bet your money for a move that is supported by two most probable scenarios.

If bulls manage to break over 4,380 the bullish scenario will become our favorite one.

However, failure of bulls at 4,380 would be a strong bearish signal and invitation to go short.

Subscribe to Free Updates

Get Unlimited Access

PrevPrevious$ES: Two Micro Path Leading Lower
Next$NQ: Two Levels to Watch: UpdatedNext

More To Explore

$ES: Bears Failed to Break the Monthly Support

$ES #Month Opening Range Yesterday, I anticipated a classic “pump-and-dump” scenario following the FOMC announcement. However, that move didn’t materialize.

CastAwayTrader May 8, 2025

$ES: Be Prepared for FOMC-Driven “Pump-and-Dump” Setup?

#FOMC #ES #corrective (a)-(b)-(c) The ES-mini bounced off the early April low in a three-wave corrective structure. So far, wave

CastAwayTrader May 7, 2025

Important Disclaimer

CastAway Trader LLC, the publisher of this web-site and videos is not registered as an investment adviser nor a broker/dealer with either the U. S. Securities & Exchange Commission or any state securities regulatory authority. Users of the website www.castawaytrader.com and viewers of the videos are advised that all information presented on the website is solely for informational purposes, is not intended to be used as a personalized investment recommendation, and is not attuned to any specific portfolio or to any user’s particular investment needs or objectives.

Trading stocks, options, or futures carries a high level of risk, and may not be suitable for all investors. Before deciding to trade, you should carefully consider your objectives, financial situation, needs and level of experience. CastAway Trader LLC provides general overview of trading methods that does not take into account your objectives, financial situation or needs. The content of this website must not be construed as personal advice. All trading setups and/or trades presented in the web site and/or trading chat room by CastAway Trader an/or by other members of the chat should be considered hypothetical for educational purposes only and should not be expected to be replicated in a live trading account.

An investor could potentially lose all or more than the initial investment. You should not speculate with capital that you cannot afford to lose. Only risk capital should be used for trading and only those with sufficient risk capital should consider trading. Risk capital is money that can be lost without jeopardizing ones’ financial security or life style.

You should be aware of all the risks associated with trading. You should seek advice from an independent financial advisor.

Any information posted on this web site is not to be construed as an offer to sell or the solicitation of an offer to buy, nor is it to be construed as a recommendation to buy, hold or sell (short or otherwise) any security. All users of the website must determine for themselves what specific investments to make or not make and are urged to consult with their own independent financial advisors with respect to any investment decision. The reader bears responsibility for his/her own investment research and decisions, should seek the advice of a qualified securities professional before making any investment, and investigate and fully understand any and all risks before investing. All opinions, analyses and information posted on the website are based on sources believed to be reliable and written in good faith, but should be independently verified, and no representation or warranty of any kind, express or implied, is made, including but not limited to any representation or warranty concerning accuracy, completeness, correctness, timeliness or appropriateness. In addition, CastAwayTrader LLC and its officers and employees undertake no responsibility to notify such opinions, analyses or information or to keep such opinions, analyses or information current. Also be aware that the owners, officers and employees of the web site www.castawaytrader.com may have long or short positions in securities that may be discussed on the website, Premium Trading Chat room and/or in the videos posted by CastAway Trader LLC.

Past results are not indicative of future profits.

Subscribe to Free Updates

Get Unlimited Access