$NQ #NQ-mini #trading futures #Elliott Wave #trading setup #AfternoonUpdate
Last week NQ-mini hit the upper red trend line and turned down as expected.
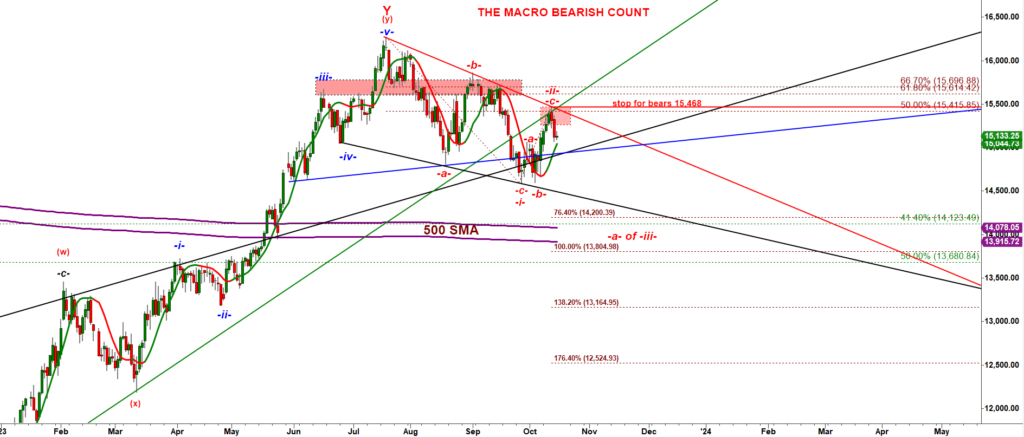
The -a-b-c- move up making yet another lower high is a short setup. This bearish wave count allows bears to push NQ down to at least 14,200 with potential extension down to 13,800 (and test the 500 SMA Daily). Note that the stop for bear scan be placed at 15,468.
Now let’s have a look at an alternative bullish scenario:
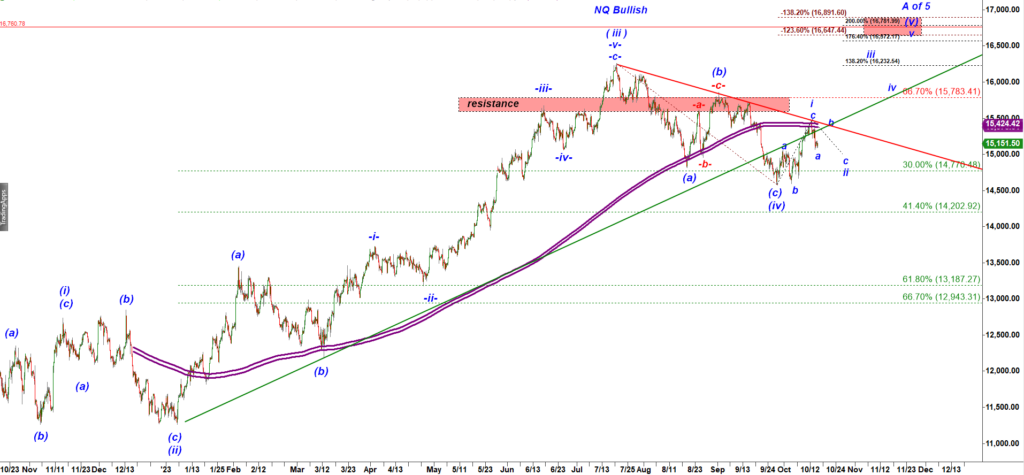
The bullish count considers the (a)-(b)-(c) move down off the July’23 high a completed corrective wave (v) up targeting a new high of the year. Note that NQ is still under two important trend lines, the red and green ones. So far the first a-b-c move up off the October low failed to break over those trend lines.
Therefore, we can conclude that bulls need to climb over 15,468 to make the bullish scenario more probable.
Let’s look at the NQ-mini chart through prism of the Month Opening Range strategy:
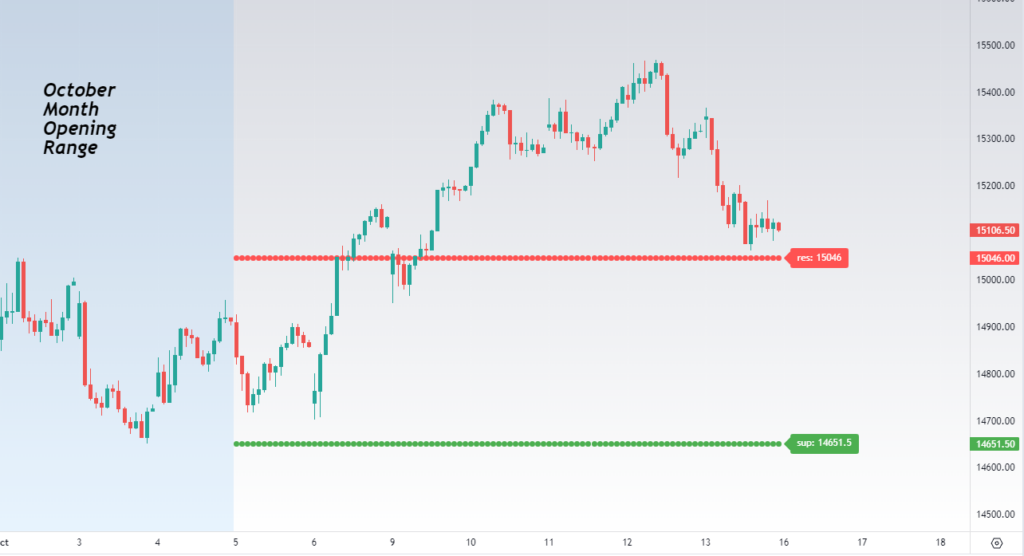
Last Friday NQ tested the broken monthly resistance-turned-support.
As long as bulls hold NQ over 15,056 the intra month trend remains up.
Let me put it in a different way.  As long as bulls hold NQ over 15,046 they can produce another rally re-testing the early month high into the end of the month.
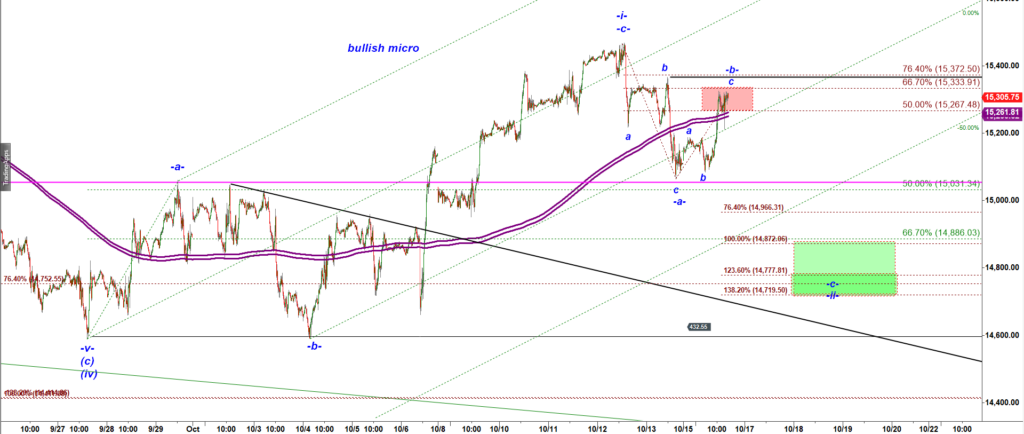
AFTERNOON UPDATE, 3-03 PM
On a micro 15 min chart this push up looks like a corrective bounce in a subwave -c- up to be followed by a wave -c- down: