$ES #FailedBreakdown #LongSetup
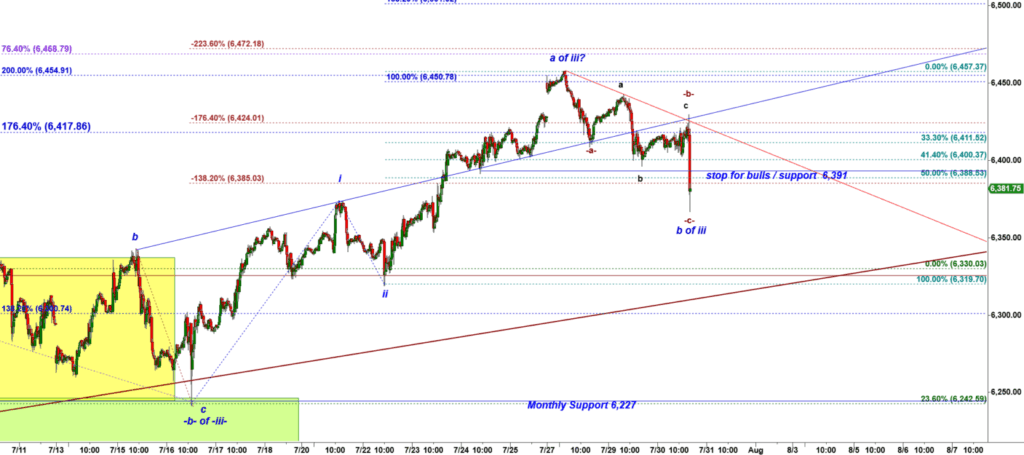
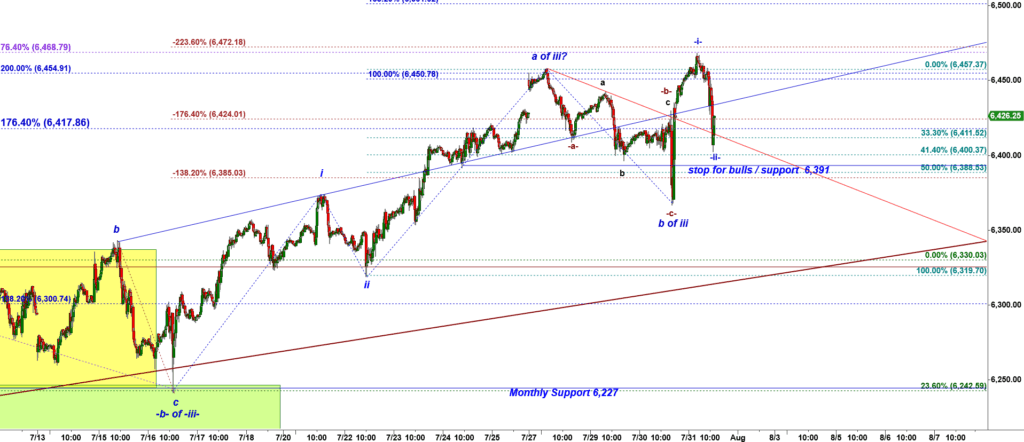
Yesterday afternoon I published a quick update and shared a wave count that considered the spiky drop as the final subwave c of a subwave -b- down of a wave -iii- up, the low of a corrective decline making a higher low.
Look at the tricky -a- down, -b- up, -c- down structure,, where the subwave -b- up was itself strctured as a-b-c shaped as the Running Flat structure:
ES-mini 15 min chart published on July 30, 2025
Note the final spiky drop in a subwave -c- down. Apparently that was a panic driven structureless drop. This type of an exhaustive drop is exactly how the second leg down in a corrective -a-b-c structure looks like.
I note yesterday afternoon:
Bulls need to reclaim that level within 24 hours to trigger a bullish failed breakdown setup.
And bulls reclaimed that broken support only 1 hour later. This is how that chart looks like now:
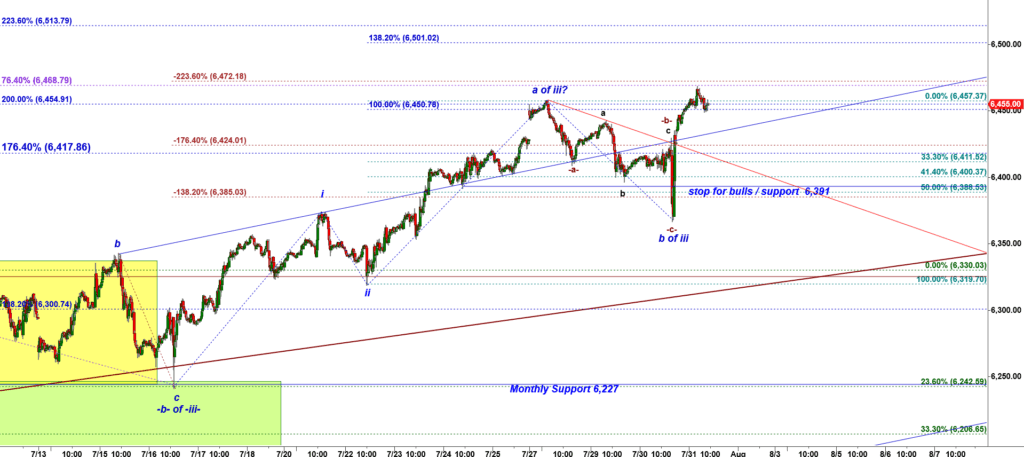
ES-mini 15 min chart
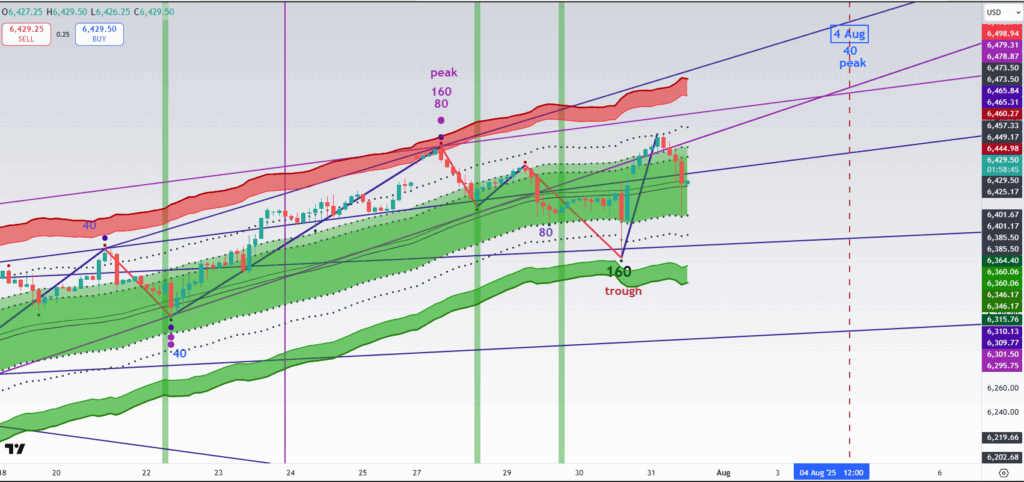
Now let’s zoom out to a 120 min chart and see where this rally may be heading:
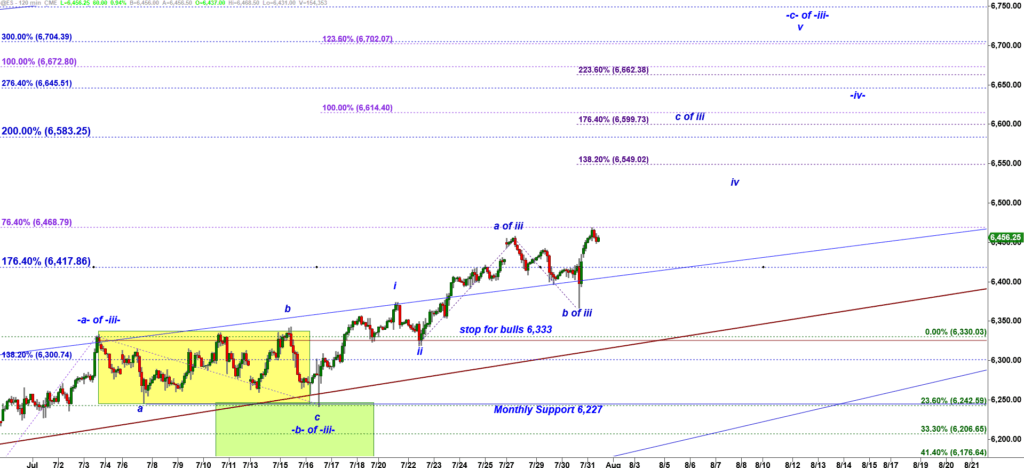
ES-mini 120 min chart
The wave count allows bulls to keep pushing ES-mini in an accelerated way up to 6,600.
This is how a micro cycle analysis looks like:
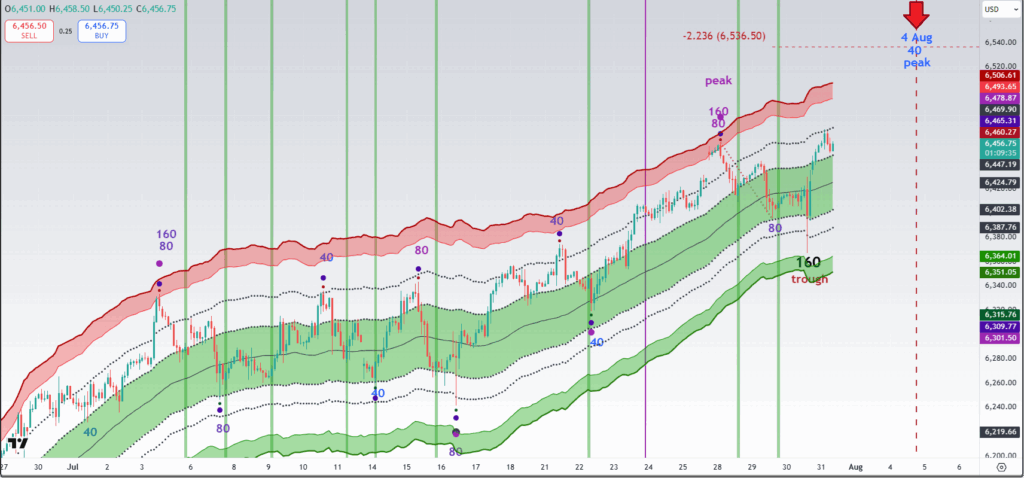
Yesterday ES-mini could make a large 160 period ( 20 day cycle ) trough.
We cab expect a minor peak of a 40 period ( 5 day cycle ) peak on Aug 4.

published at 11-59 AM
ES-mini 15 min chart
We got another bullish -i- up, -ii- down setup for a rally where the wave -i- up has made a higher high and subsequent drop in -ii- down made a higher low.
looking at the green chart drawn by my brand new CAT Channel Pro indicator we can note that bears have teste the lower boundary of the green channel:
ES-mini 120 min chart
Shoot me an email to castawaytrader@gmail.com if you want to test the new indicator for TradingView!