$ES #breakout #breakdown #Inverse Head and Shoulders
We’re seeing another potential breakout setup reinforced by a long -i- up, -ii- down setup.
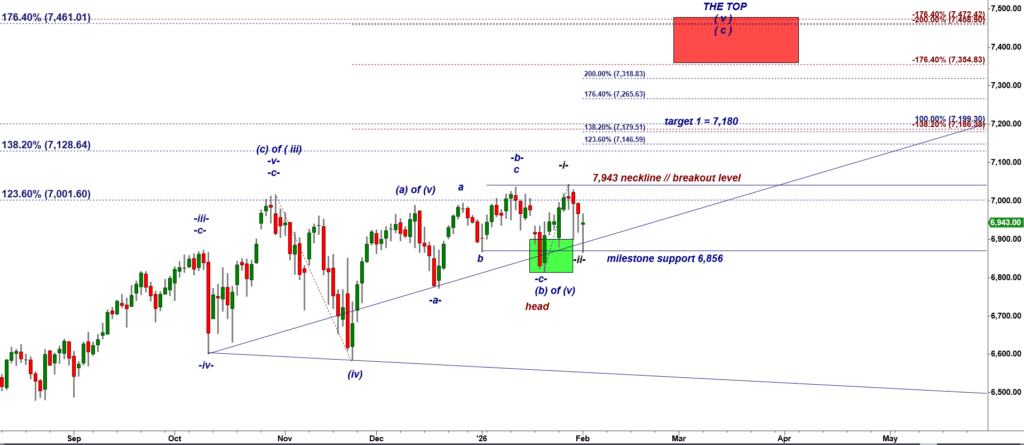
ES-mini Daily chart
What makes this one especially interesting is the clean inverse head and shoulders structure developing on the chart. That adds strong bullish context to the setup.
Plan A (Bullish):
Go long on a decisive break above the 7,943 neckline.
Plan B (Invalidation / Bearish):
Go short on a break below 6,822. A move below that level would invalidate both the -i- up, -ii- down structure and the bullish inverse head and shoulders pattern.
Keep watching the key yearly levels:
• 2026 Resistance: 7,036.25
• 2026 Support: 6,814.50
We are entering a high-volatility period during the first three trading days of the new month. This is typically when the market expands its trading range and establishes the key boundaries — monthly resistance and monthly support — that are likely to influence price action throughout the next four weeks of February.