#ES-mini #S&P500 #Elliott Wave
We can count the rally in the cash index S&P 500 as a five up rally:
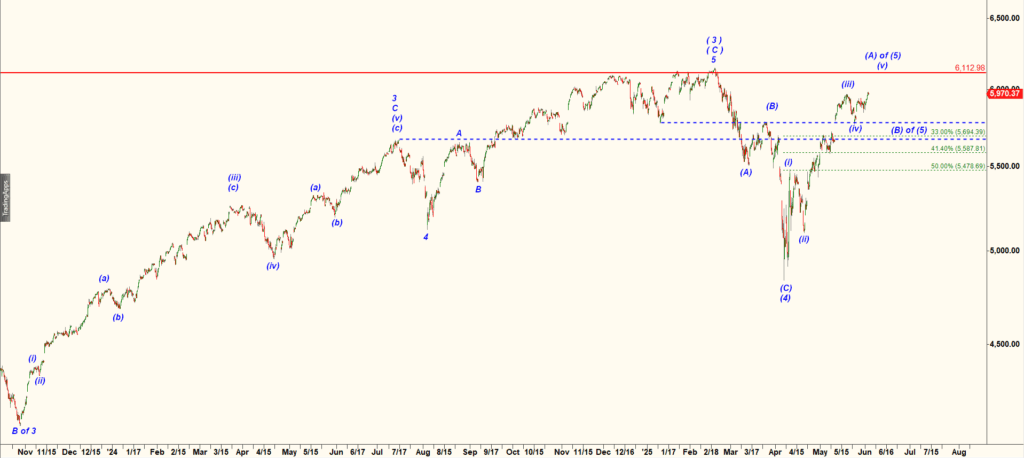
SPX 120 min chart
zooming-in:
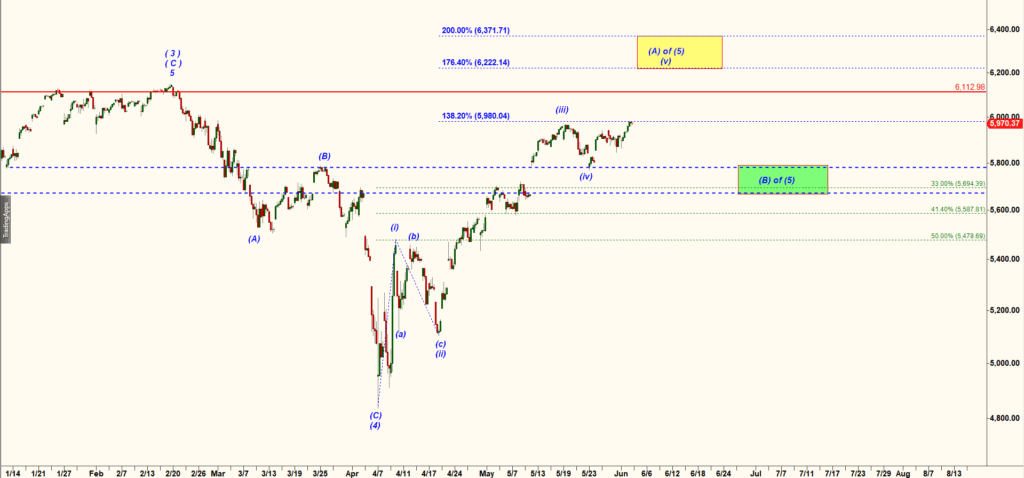
SPX chart 120 min
That wave count allows bulls to push S&P higher up to 6,222 to retest the top made in Feb’25.
ES-mini is futures that is traded almost 24 hours six days a week. So naturally it quite often has a different wav ecount:
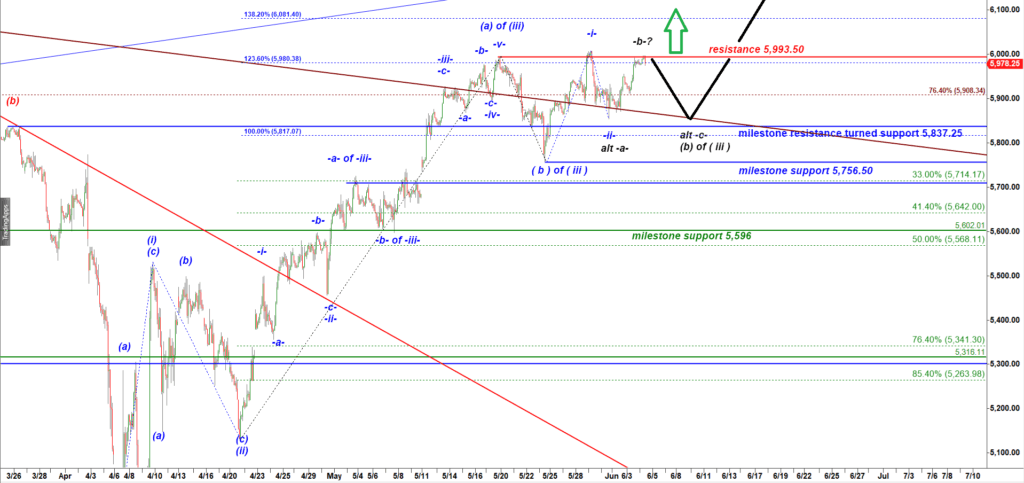
ES-mini 120 min chart
It is possible to count the move up off the April’25 low as a much more bullish five wave up structure that has only completed the first part of the move, specifically topped in a subwae (a) of wave ( iii ) up.
The micro question here if ES-mini has already completed subwave (b) down of wave ( iii ) or needs one more micro push down.
Break over 5,993.50 resistance would confirm that very bullish scenario and allow bulls to push ES-mini up to 6,200 in a subwave -a- of wave -iii- up of (c) of ( iii ).
Alternative micro path: If bulls fail to break over that resistance we can get another trip down in a subwave -c- targeting 5,877. That decline in a subwave -c- down would provide bulls with yet another opportunity to start a bigger rally in a micro wave -iii- up.
📆 Today marks the third trading day of the new month.
Over the past three sessions, we’ve seen a steady, grinding move to the upside. This price action has carved out a short-term trading range, with key levels now clearly defined:
- 🟢 Monthly Support: 5,867.50 (established as the range low)
- ⚖️ Monthly Pivot: 5,933 (mid-range marker)
🚨 Key Scenario to Watch:
If bulls fail to break above the 5,993.50 level and bears manage to push the ES back below it, this would trigger a failed breakout short setup. In that case, Target 1 becomes the Monthly Pivot at 5,933.
Stay nimble and watch these levels closely—momentum could shift quickly.