$ES #NQ $NQ #Elliott Wave #trading setup
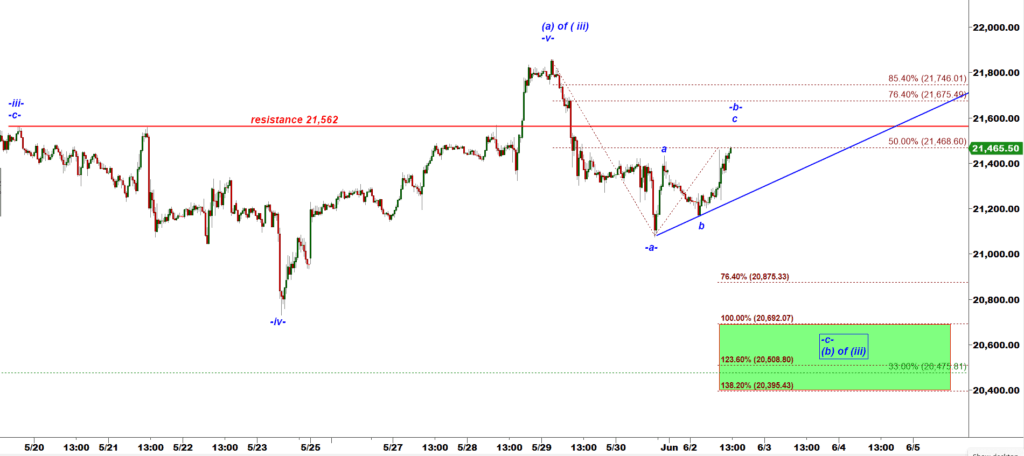
Bears may produce one more push lower in both Es-mini and NQ-mini to complete a micro -a- down, -b- up , -c- down corrective structure:
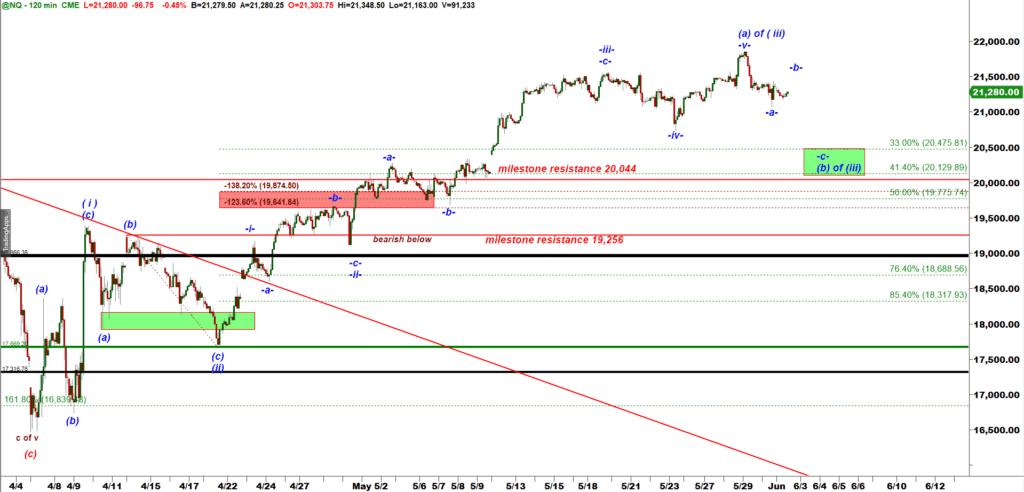
NQ-mini 120 min chart
Let’s zoom in to a 30 min chart:
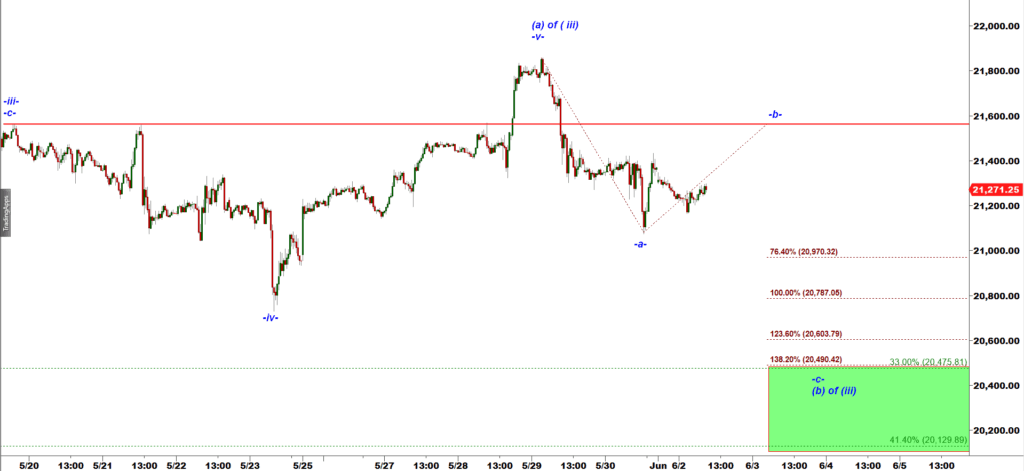
NQ-mini 30 min chart
Now let’s have a look at ES-mini chart.
As we discussed in my weekend update, bull may not be ready for that breakout:
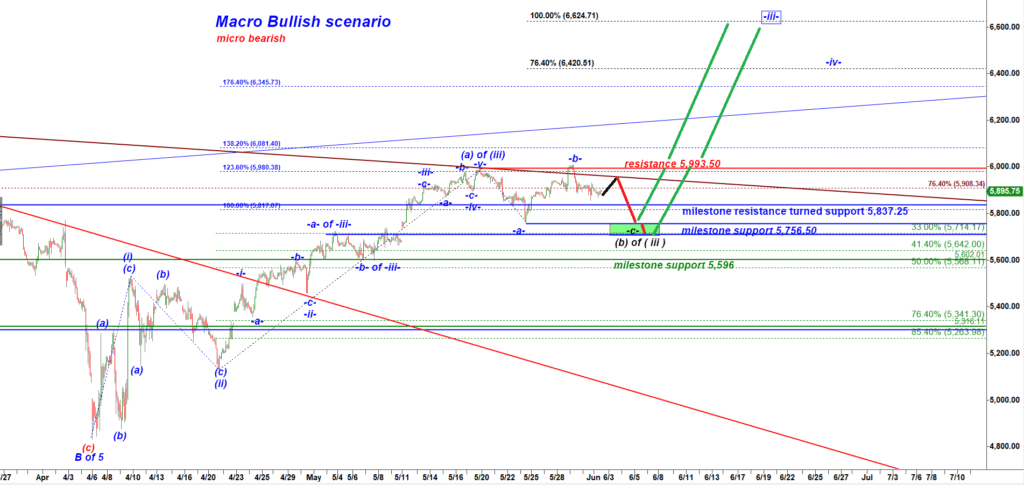
ES-mini 30 min chart
The micro bearish scenario allows bears to re-test the recent low made at 5,756.50 (with potential spike down to 5710 o retest the top of -a- of -iii- up from above ) in order to complete a large flat -a- down, -b- up, -c- down structure of the subwave (b) down of wave ( iii ) up.
When we get an impulsive looking five wave rally subdivied into five micro waves and then instead of a strong rejection we see a flat a-b-c structured flat and shallow consoldation we considered that structure as a re-accumulation pattern building a base for another impulsive rally.
WARNING: Break under the milestone support 5,596 would remove that bullish macro scenario off the table and make me come back to the macro bearish scenario that considers the whole three wave move up off the early April’25 low as a large wave B up to be followed by another strong five wave move down in a subwave C down targeting 4,500.
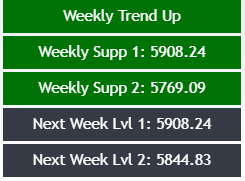
The direction of the weekly trend as calculated by the Cycle Trader indicator helps us to correctly identify the directional bias
Note that currently ES is sitting at the Weekly Support 1 = 5,908.

published at 1-49 PM EST
NQ-mini 30 min chart
We got a corrective looking a-b-c up bounce off the Friday low:
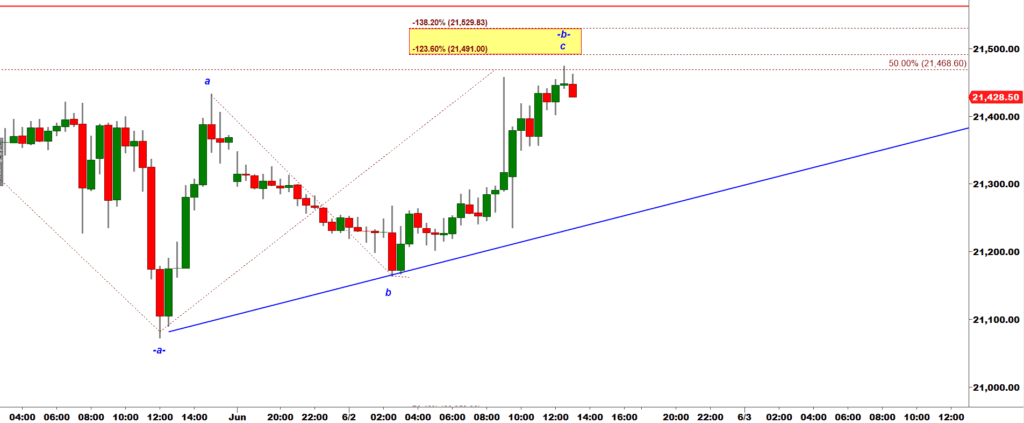
NQ-mini 30 min chart
NQ hit the resistance of the black Daily Pivot 21,465:
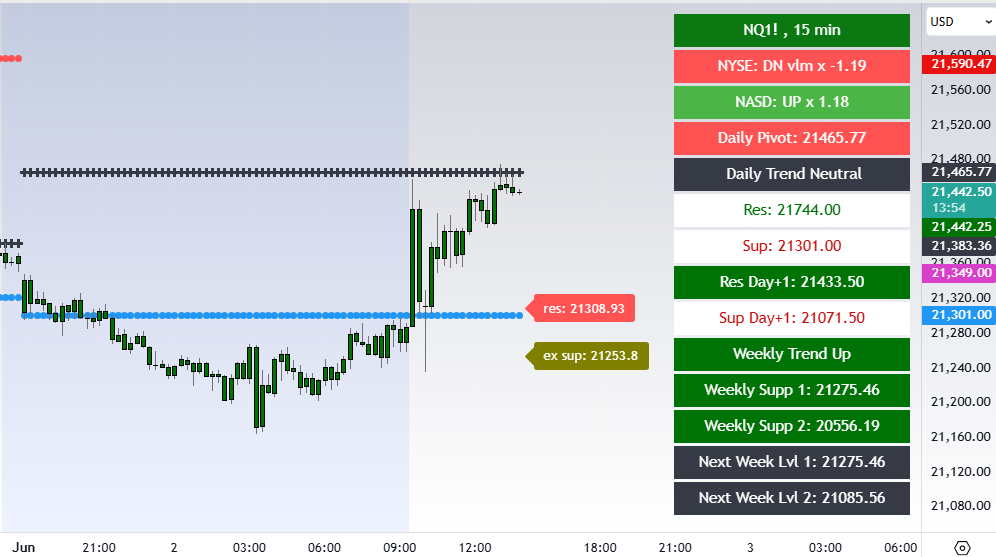
That is a decent opportunity for bears to turn NQ down and start a wave -c- of (b) down.
A similar picture we can find in ES-mini:
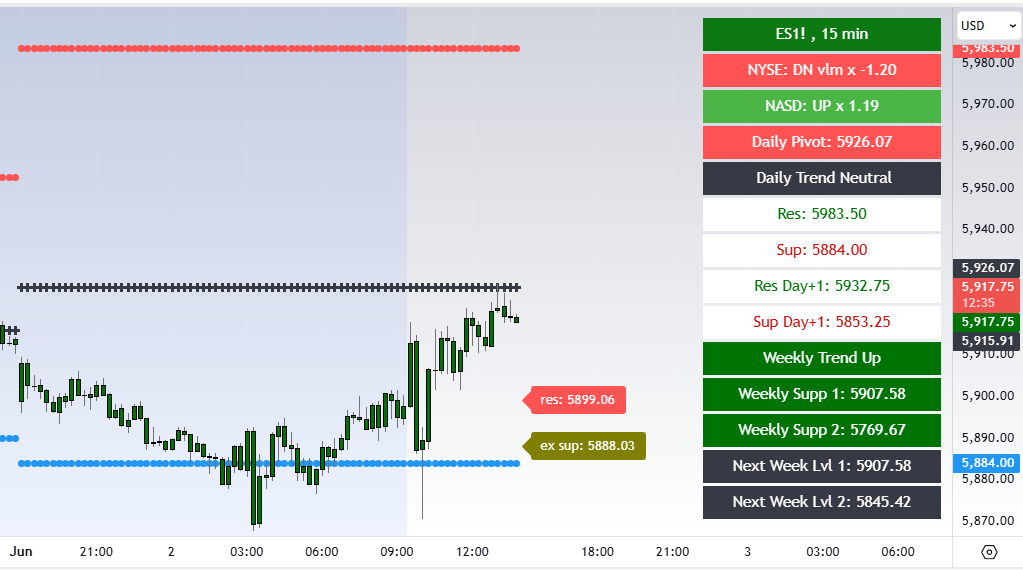
Bear stopped bulls at the resistance of the black Daily Pivot 5,926.
Break and day close over the daily pivots would be a bullish sign.