$ES #ES-mini #Elliott Wave #trading setup
It’s always easy to recognize a completed five-wave rally after the fact.
But in real time, things get tricky—especially in the early stages of a potential impulsive move.
When we see a rally made up of an initial wave 1 up, a wave 2 pullback, and then another strong push higher, that move often looks like a three-wave structure — not the clean five-wave pattern bulls hope for.
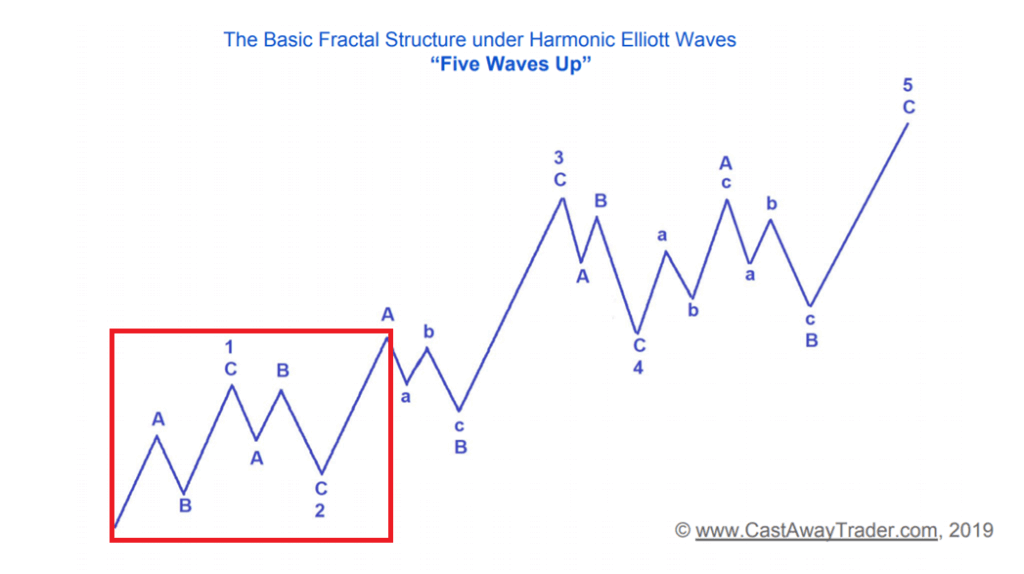
There’s no guarantee that this three-wave advance off the last corrective low will evolve into a full five-wave rally.
What bulls need to see for a high-probability long setup — to ride the next leg up in subwave C of wave 3 up — is a shallow, sideways a-b-c pullback that would mark subwave B of wave 3 (see teh green box on the chart below):
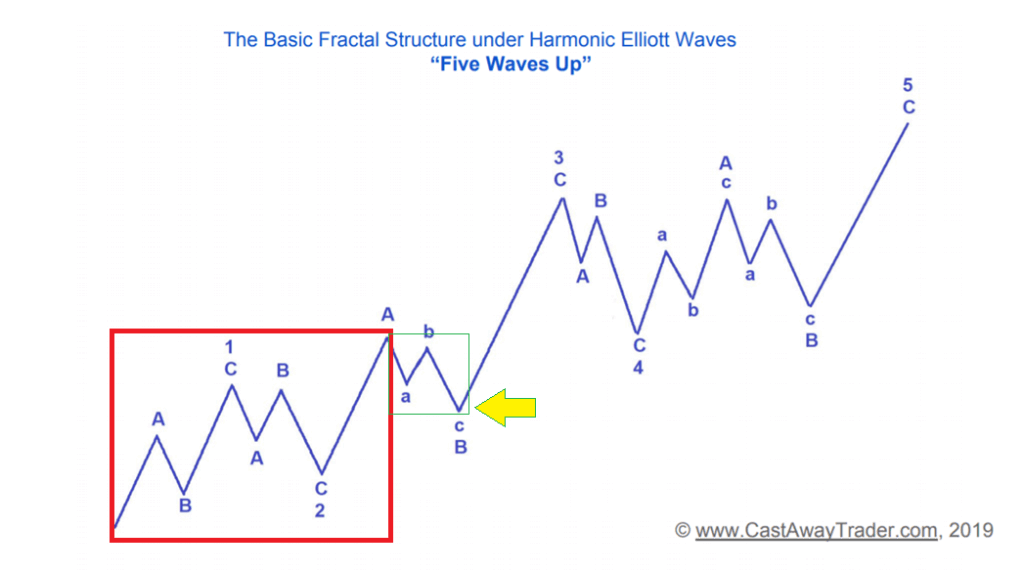
Bears hope that this three wave rally will not have a follow through.
Bears know that corrective (a) up, (b) down, (c) up structures quite often terminate at either a 123.6% ext of the first leg up or 138.2% extension.
This is why we can reasonably expect bears to get active again in the zone 5,980 – 6,080.
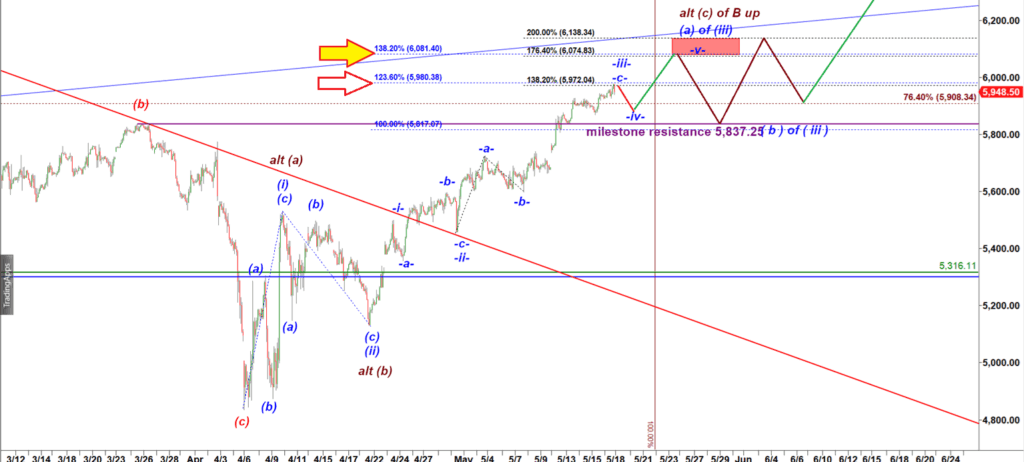
ES-mini 120 min chart
On OPEX Friday, the S&P 500 futures (ES) hit the 123.6% Fibonacci extension at 5,980, a classic resistance level where corrective structures — like (a)-(b)-(c) moves — often complete.
That said, the key level for bears remains the 138.2% extension at 6,081.50.
It’s possible we’ll just see a minor dip from the 5,980 area down to 5,875, representing a micro wave -iv- down.
🟩 As long as bulls defend the breakout line at 5,837, I expect one final push in micro wave -v- up toward 6,081.
From there, we’ll closely watch how the market reacts.
A sharp drop back to 5,837 would be the first real sign that we completed a corrective three-wave bounce — and not a bullish subwave A of a much larger wave 3 up.
🟩 If we get a flat a-b-c down structure off 6,080 resistance holding over 5,837 (as shown on the chart above), that would be a great attractive long setup to ride a strong rally in a wave (c) of ( iii ) up targeting 7,000.