$NQ #Conflicting Scenarios #Elliott Wave
The Nasdaq (NQ) is tracing a structure that closely resembles that of the ES-mini (discussed in the weekend update). Bears are still clinging to the possibility of halting this rally at the classic Fibonacci resistance zone—specifically, the 123.6% to 138.2% extension of the initial leg up off the early April low.
This zone often marks the termination point of a three-wave corrective bounce, particularly when it unfolds after a major low.
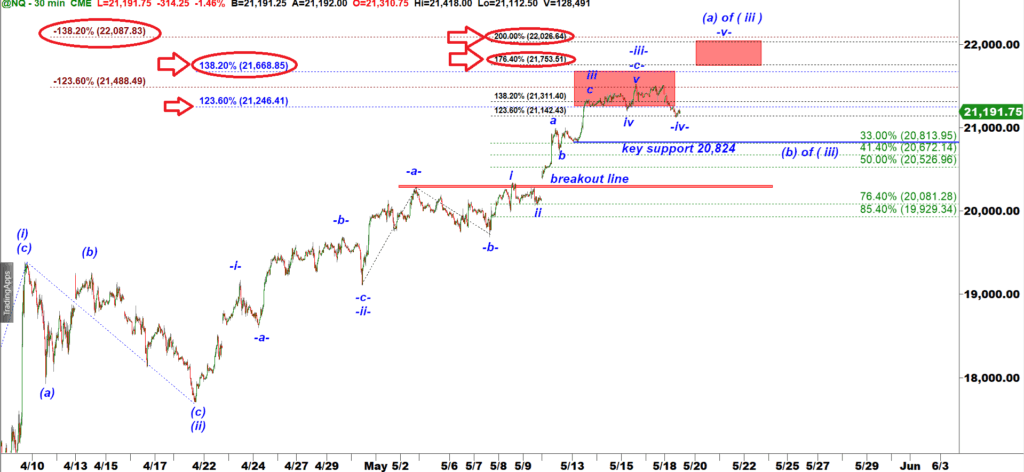
NQ-mini 30 min chart
That same Fibonacci range also serves as a common topping area for subwave A of wave 3 up within a standard five-wave advance:
📊 In both bullish and corrective scenarios, this area becomes a recurring inflection point.
That puts us at a critical crossroads.
To validate the bullish case, we need to see a flat and shallow a–b–c pullback from the potential high of subwave (a) of wave (iii) up. This would pave the way for a continuation in the form of micro wave –v–.
🔍 Key Level to Watch: 20,824
As long as bulls defend 20,824, there’s room for one more squeeze higher—targeting 21,754 in the final push of micro wave –v–.
AFTERNOON UPDATE posted at 11-50 AM
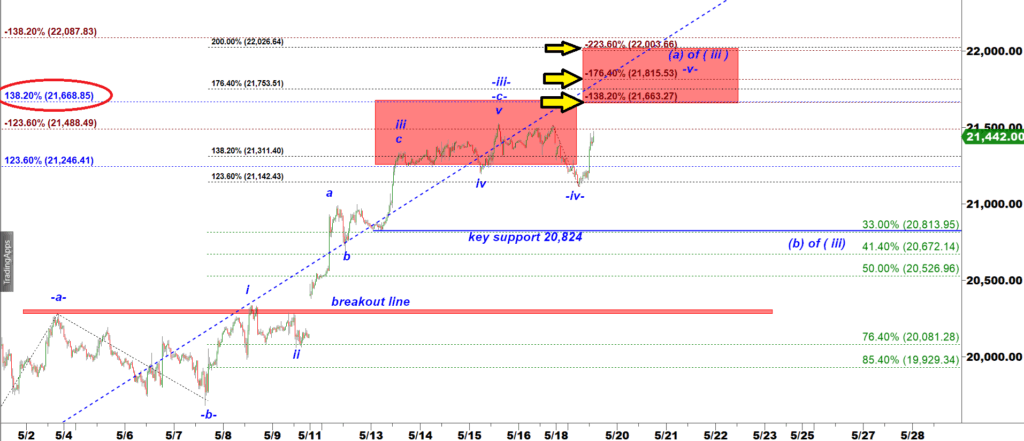
NQ-mini 30 min chart
The pre-market decline was all of the wave -iv- down. That move up looks like a start of the wave -v- up. The target 1 for this move up is a negative -138.2% ext = 21,663. This morning I noted:
…”As long as bulls defend 20,824, there’s room for one more squeeze higher“.
That wave -v- up should be followed by at least a large -a-b-c- down corrective structure that can test the key micro support 20,824.