$ES #ES-mini #Elliott Wave #trading setup
The red line indicates a major level of resistance at 6,155 – 6,162.50:
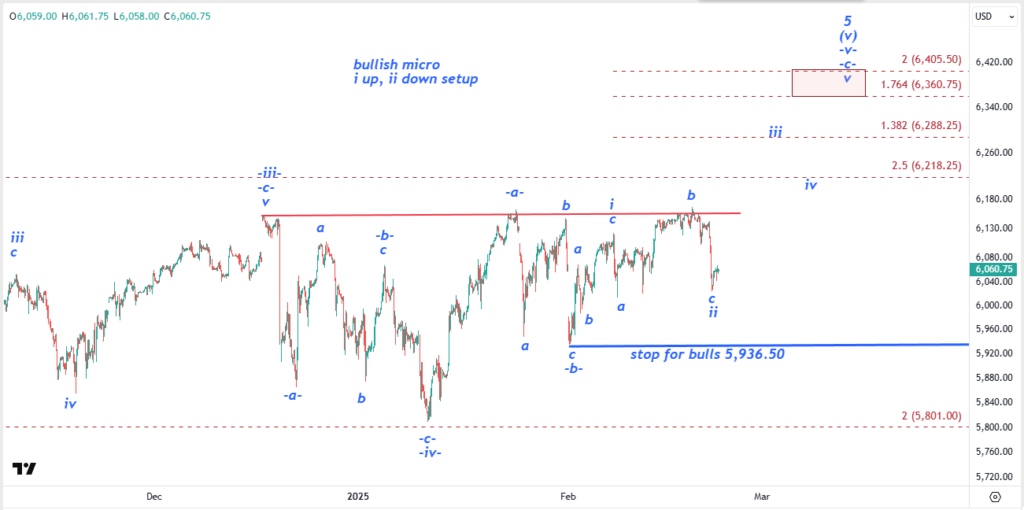
ES-mini 120 min chart
That level got tested four times already.
The Friday drop can be considered a subwave c of yet another flat a-b-c down corrective structure (see the right yellow rectangle):
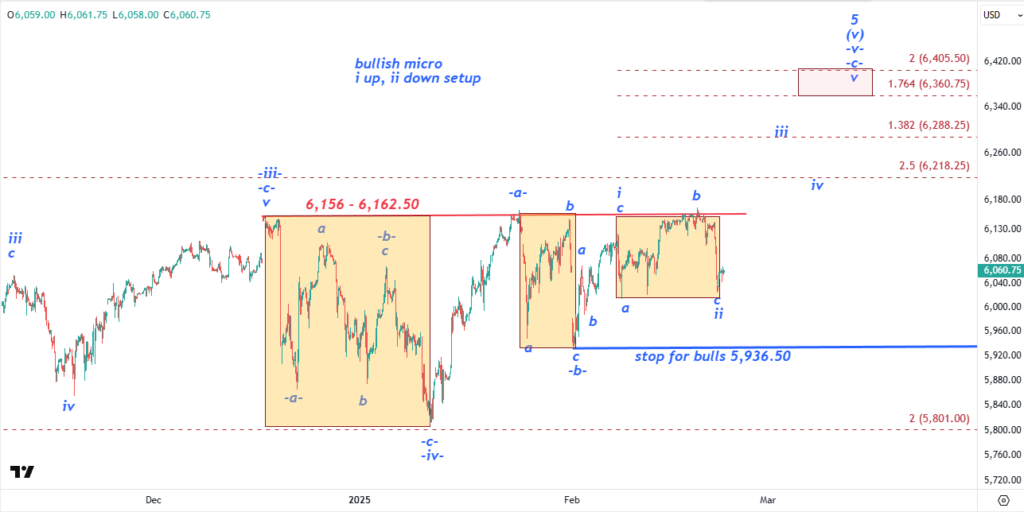
ES-mini 120 min chart
You can observe three completed a-b-c corrective structures moving downward. Typically, when an a-b-c correction remains close to the recent high, it sets the stage for bulls to initiate a new upward leg, breaking above the previous high.
However, the bulls have failed twice—unable to push beyond the tops of the two yellow boxes.
Now, they have a third opportunity with a long setup, that has to be triggered by a break over the red horizontal line.
The drop on Friday marked the 13th price swing within the 5,860 – 6,160 range. At this stage, we need to wait for a breakout from this consolidation zone.
This bullish wave count allows bulls to make two more pushes higher and test the Red Box at 6,360 – 6,400. But that setup will get invalidated if bears violate the immediate support at 5,936.50.
BONUS: Let’s review this repeating bullish reversal candlestick pattern on a Daily chart of ES-mini:
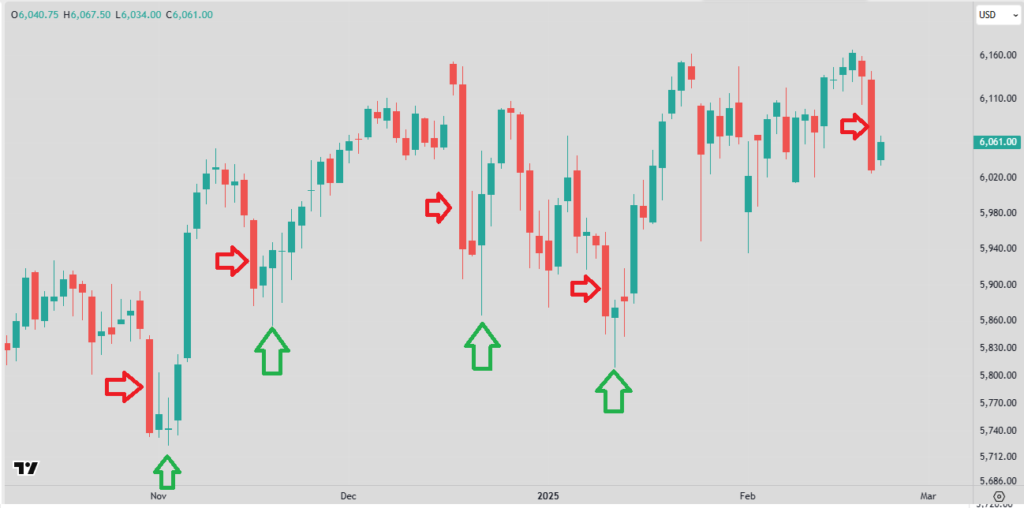
That bullish reversal candlestick pattern is composed of three daily candles:
Candle 1: A large red bearish candle closes near its low, indicating a strong downtrend for the day.
Candle 2: A small candle forms next, opening within the range of the previous large red candle, showing hesitation or consolidation.
Candle 3: Another candle opens within the range of the initial large red candle, briefly breaks below its low but then recovers to close back above that level—an intraday bullish reversal.
This pattern presents a solid long setup. If a similar scenario unfolds, we may see bears attempting to break below Friday’s low either today or tomorrow.
If a new lower low under the Friday’s low is made, but bulls manage to reclaim and close above 6,024.50, it would confirm a strong long setup.