$ES #ES-mini #Elliott Wave
Yesterday bulls tested the Yearly Resistance 6,162.25 but today they dropped the ball and price dropped 50 points. Let’s discuss how that move down changes perspective of bulls and bears.
That chart nicely illustrates what a 76.4% ext of a micro wave -i- up is such an important resistance, a “test” level as I call it:
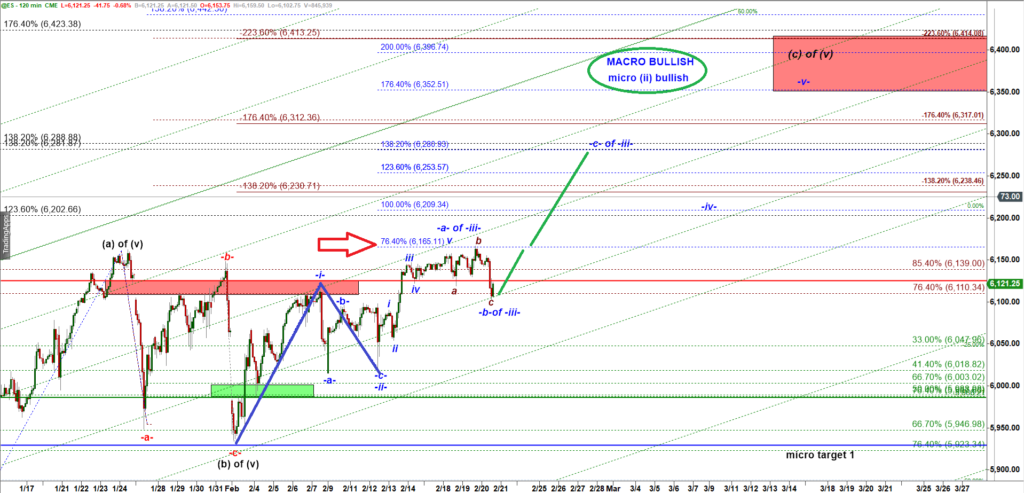
ES-mini 120 min chart
This chart clearly illustrates why the 76.4% extension of a micro wave -i- up is such a crucial resistance level—a “test” level, as I call it.
📈 At this point, bulls must prove they have initiated a new leg up in wave -iii-.
🔹 Classic Elliott Wave Theory (EWT) considers this move as wave (i) of 3 up.
We saw a significant decline from the 6,165 “test” level, which now serves as a key breakout point.
Another reason why the 76.4% extension is such an important test level is that, in 30% of cases, bulls fail to push past it. When that happens, it leaves only a three-wave move up, meaning the five-wave structure remains incomplete—indicating that the move was likely just a corrective bounce rather than the start of a true bullish impulse.
🔻 Bearish Scenario:
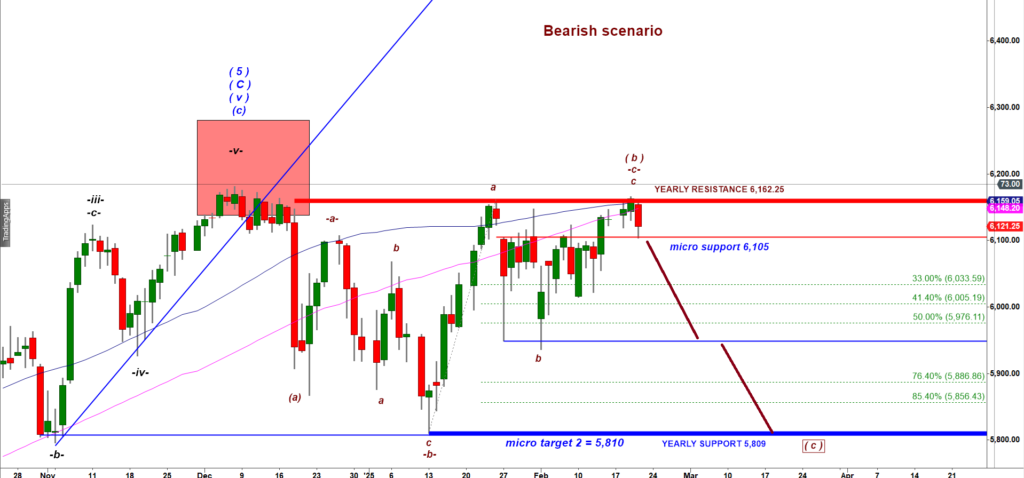
ES-mini 120 min chart
🐻 Bears are liking what they see here. Bulls failed to break above the Yearly Resistance at 6,162.25.
The move up from the last major low on January 13th has a clear three-wave structure, which suggests it may be just a corrective wave (b) up rather than the start of a strong bullish impulse.
This recent drop has energized the bears.
🔑 Key support level for today’s daily close: 6,121.25
If bears manage to close a day today below 6,121.25, it would confirm a bearish two-close reversal pattern, strengthening the downside case.
📌 Expect bulls to fight hard to defend this level.