$ES #breakout #gathering pattern #flat consolidation
We are starting the day exactly where we started Tuesday, right under the Yearly Resistance 6,162.25:
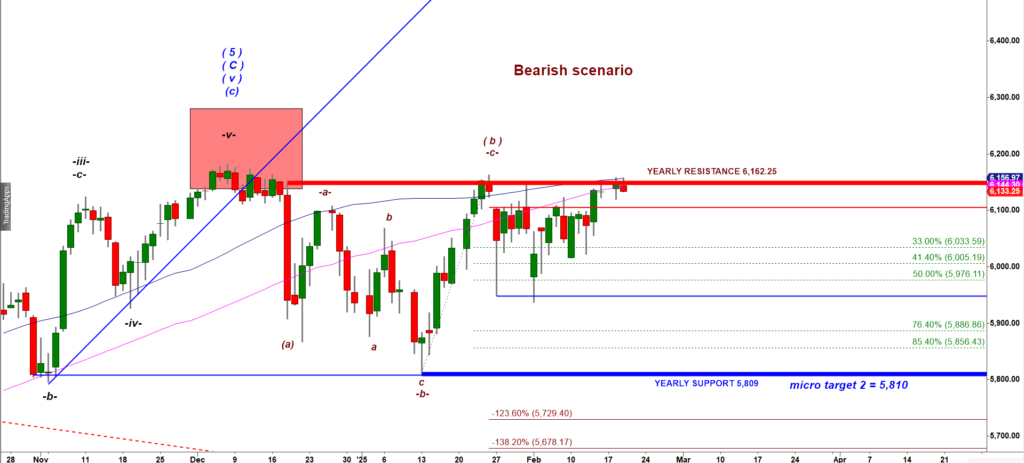
ES-mini Daily chart
Bulls tested the Yearly Resistance 6,162.25 again but failed to break over that level again.
When we deal with a bearish scenario and price hits a strong resistance without strong rejection that is a warning sign for bears.
In contrast, so called “gathering pattern” comprised of several low range bars right under a strong resistance is an encouraging sign for bulls.
ES-mini Bullish wave count:
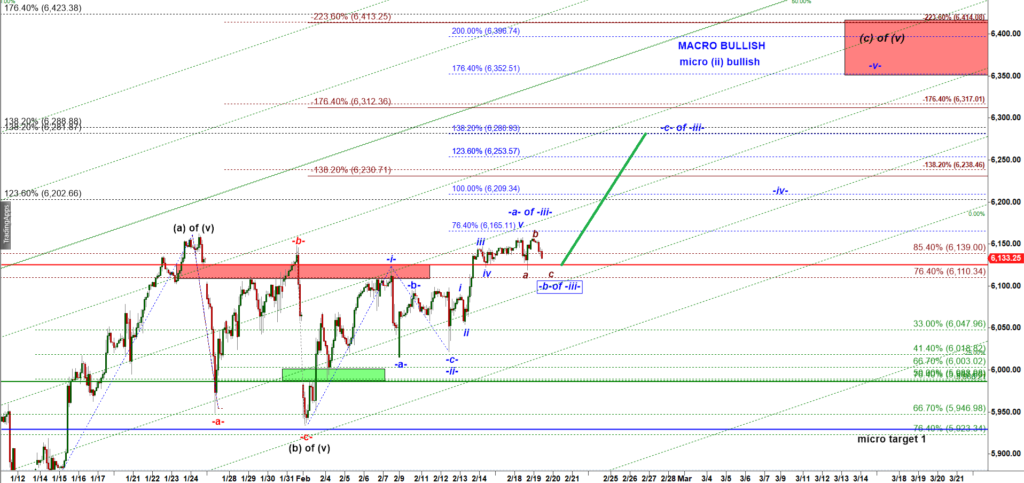
ES-mini 120 min chart
We are getting a flat and shallow a-b-c down consolidation right under a resistance that needs to get broken. It is very difficult to break a strong level of resistance from the get-go. Many oscillators got into “overbought” are by the preceding move up. This is why the market takes a pause to reset the indicators and build a base for the next move up over the strong resistance.
Let’s look at a micro structure of that consolidation:
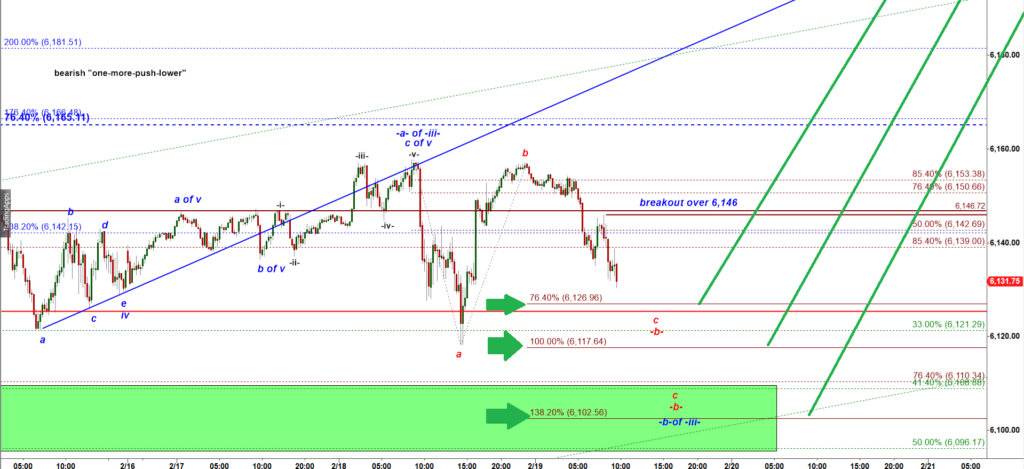
ES-mini 30 min chart
There are three key levels where this second leg down in the micro wave c down could find support: 6,127, 6,117.50, and, in a bearish scenario, 6,102.50.
It’s difficult to predict exactly where the drop will stop, but a move back above 6,146 would provide strong confirmation that the corrective a-b-c down pullback has likely completed. This would suggest that a new, larger, and more accelerated leg up in subwave C of wave iii has begun.
📈 Target for subwave C of wave iii: 6,280
🚨 To maintain the bullish scenario, bulls must keep ES above 6,088 at all times. Break under that level would be a strong argument in favor of the Bearish scenario shown at the top of this update.