#ES #Elliott Wave
This is why bulls have a problem with push ES higher:
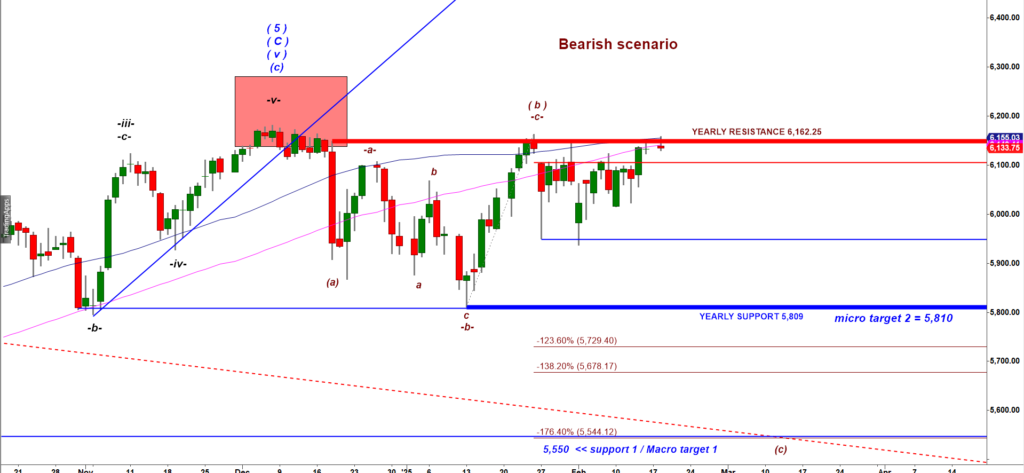
ES-mini 120 min chart
6,162.25 is the Yearly Resistance for the whole 2025 year.
That is the highest high made by bulls during the first three full weeks of a year.
Break over that level would open potential for a new big rally.
In contrast, bulls’ failure (failed breakout) would would allow bears to re-test the mid range 5,976 and potentially the blue line, the Yearly Support 5,810.
This is how the bearish rejection off 6,162 level should be considered under the bullish wave count:
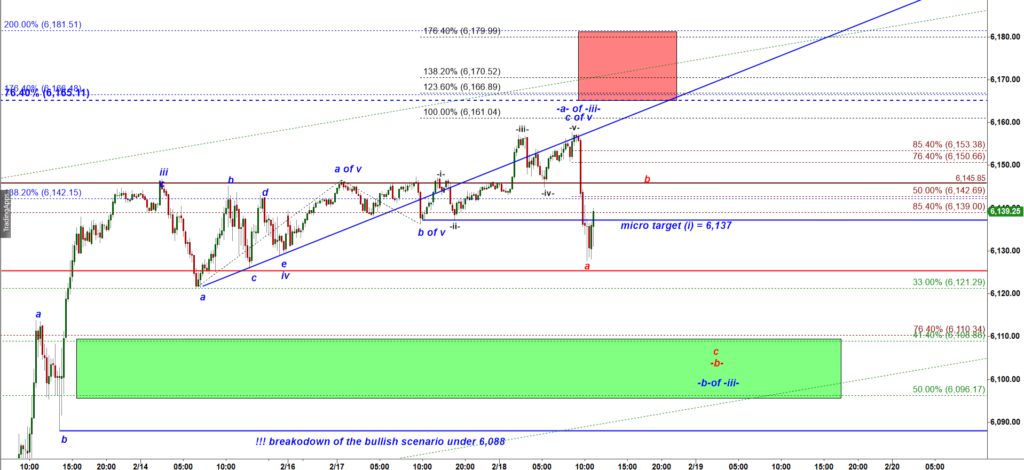
ES-mini 120 min chart
Bullish Scenario Update
Most likely, subwave -a- of wave -iii- up has topped, and a corrective a-b-c decline in subwave -b- down of wave -iii- up has begun.
✅ Key Bullish Level: Bulls must hold ES above 6,088 at all times to keep the bullish scenario intact.
I’d count this morning’s drop as subwave -a- down, followed by a bounce in subwave -b- up.
🔹 Key Resistance: The Friday high at 6,146 now acts as a crucial resistance level.
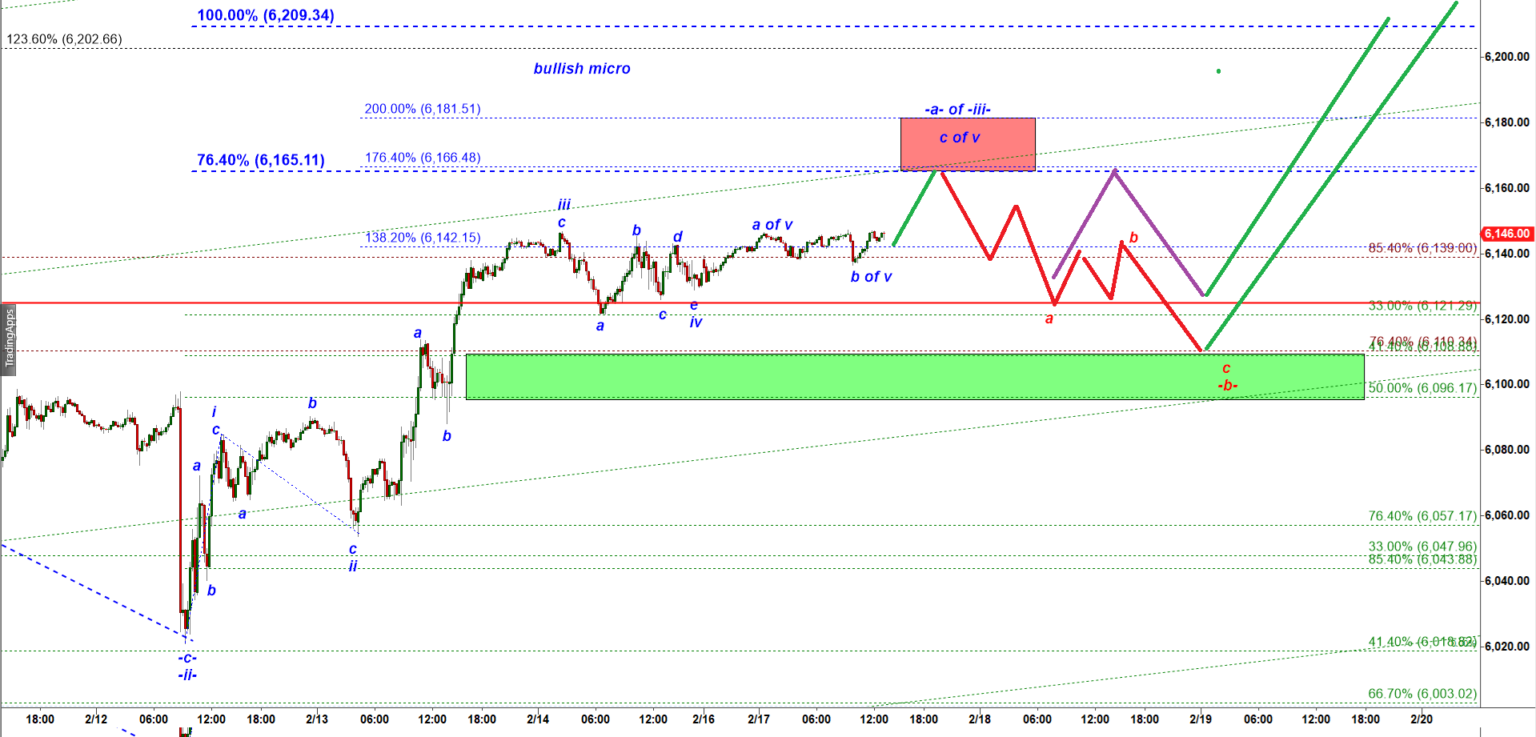
🔹 Ideal Setup: If this bounce fails at 6,146, bears should take control and push ES down one more time toward the Green demand zone.
One more leg down to the Green Demand zone would complete a corrective a-b-c down structure and set the stage for a breakout over the Yearly Resistance 6,162.25.
I posted two alternative micro paths for that a-b-c down consolidation we are getting today, see the chart.