$ES #ES-mini #Elliott Wave
We still have two very different scenarios in play:
Bearish Scenario:
This view considers the early December 2024 high as the top of wave 5 up. Under this bearish wave count, the whipsaw movement following that high is seen as part of a corrective a-b-c up pullback:
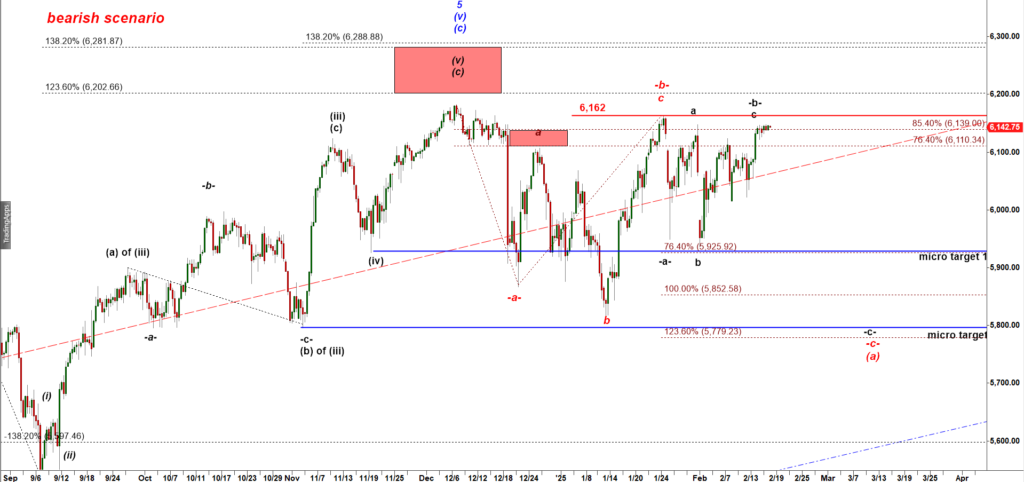
ES-mini 120 min chart
Break over 6,162 resistance will make that bearish scenario much less reliable. The bearish count allows bears to produce a large leg down in a wave -c- targeting 5,925.
Bullish Macro Scenario:
Bullish scenario argues ES-mini has been moving up in an unfolding five wave up structure that allows bulls to push ES-mini up to 6,350 – 6,400.
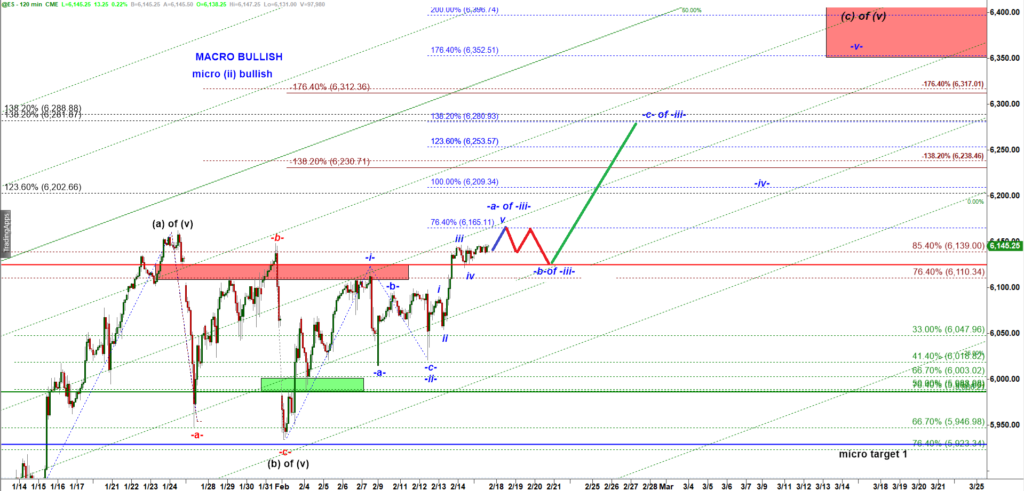
ES-mini 120 min chart
The ideal micro path is one more push higher to 6,165 (with potential extension to the upper edge of the Red Box at 6,180) followed by a bearish reversal and drop back down first to 6,137.
The logic here is that hitting 6,165 would complete a five-wave micro structure for subwave -a- of wave -iii- up:
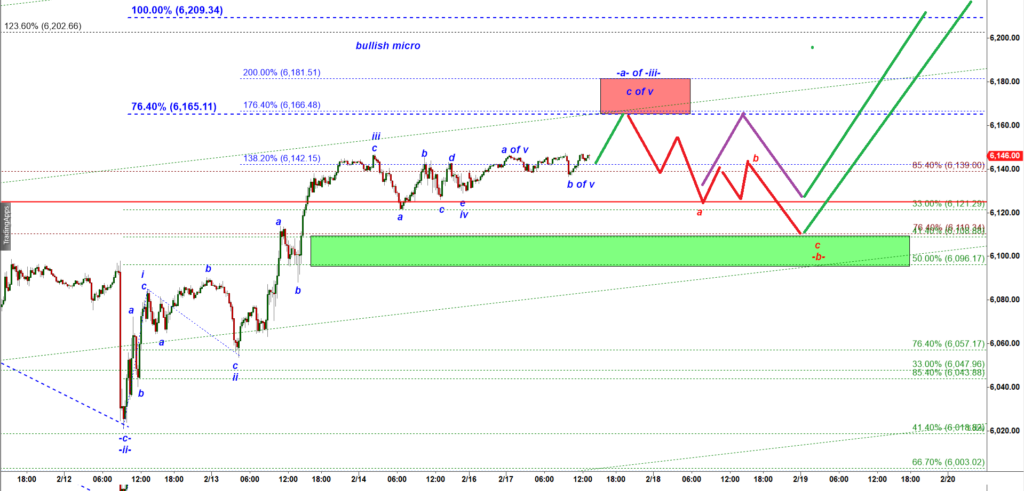
ES-mini 15 min chart
Upon completion of a push up into the Red Box (see a micro count on a 15 min chart above) we would expect an a-b-c- down consolidation in a subwave -b- down of wave -iii- up.
When Bears Should Do to Take Over?
🚨 6,088 is the invalidation level for bulls. A break below this level would activate the bearish scenario. However, if bears manage to push below 6,088, expect an initial a-b-c corrective bounce making a lower high—so patience is key before confirming downside continuation.