$ES #ES-mini
On Friday Es-mini dropped under support and invalidated the bullish -i- up, -ii- down setup.
Remember a rule of thumb “almost every big drop starts from invalidation a promising bullish -i- up, ii- down.”
Let’s look at the bearish macro scenario:

ES-mini 8 hour chart
I would expect bears to tag the micro target 2 = 5,810 in coming days.
The first part of February has been bearish over the last 20 years:
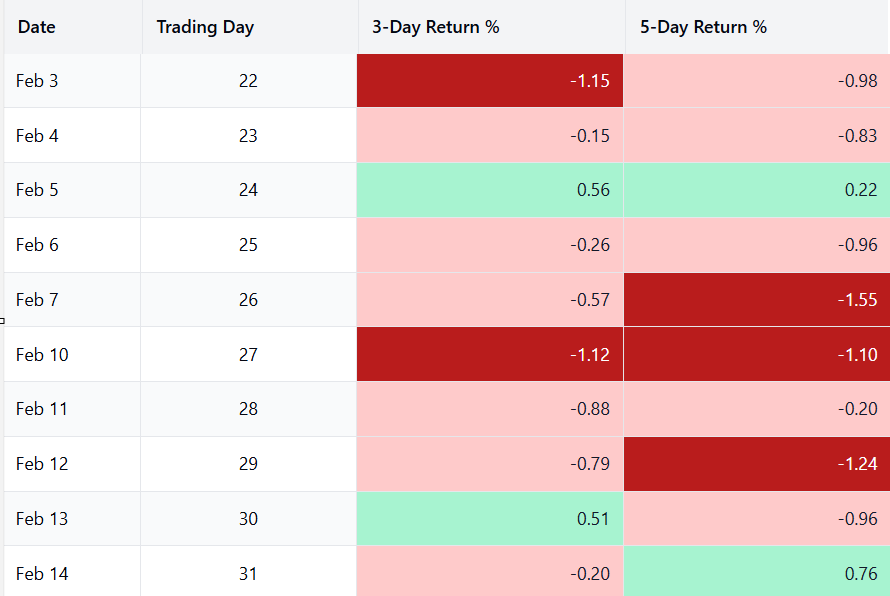
You can see historical forward 3 day and 5 day returns. That table tells you that over the last 20 years if you went long on Feb 3 you would lose money on a 3 and 5 day horizon.
Lets look ata micro picture:

ES-mini tick bar chart
ES-mini can drop down to 5,884 in a direct way dropping from here to 5,884. Or, alternatively, it may follow a more tricky path dropping down to 5,950-5,940 completing a micro bullish inverse head and shoulders pattern and then rally again up to 6,015 – 6,024. That corrective rally would complete a textbook a up, b down, c up corrective structure.
Monthly Pivots:
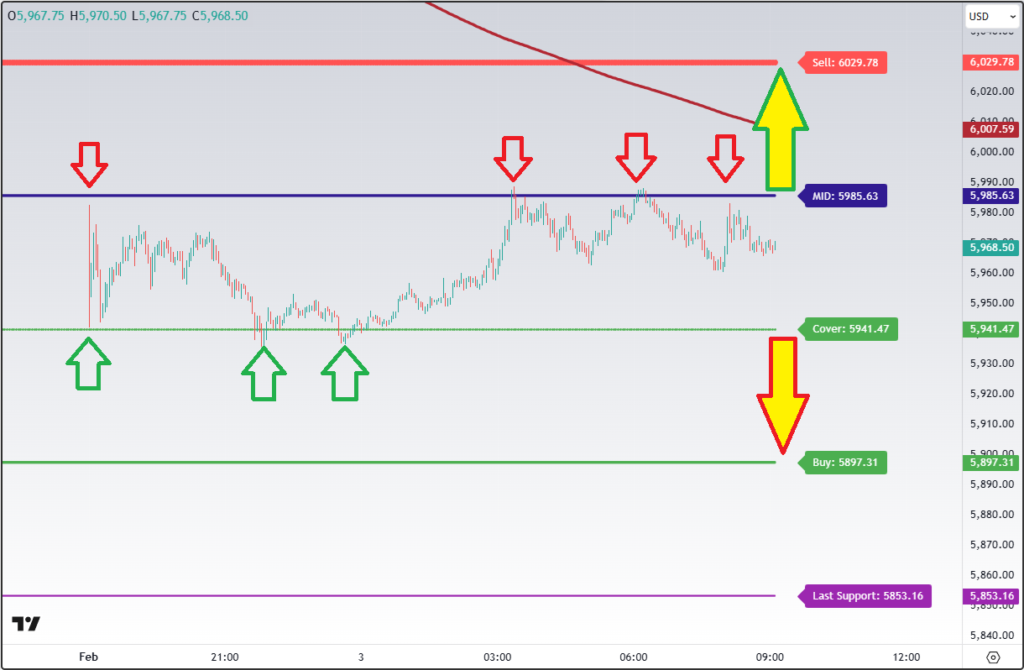
Note how well ES-mii has been bouncing in between of monthly pivots.
The blue pivot is the key resistance. Break over 5,985 would open the door for a rally up to 6,029.
A break under the green pivot 5,941 would open the door for a drop down to 5,897.
Note the Yearly Support for 2025 = 5,809.