$RTY #Macro #milestones
Check how price stumbled upon the red line three times:
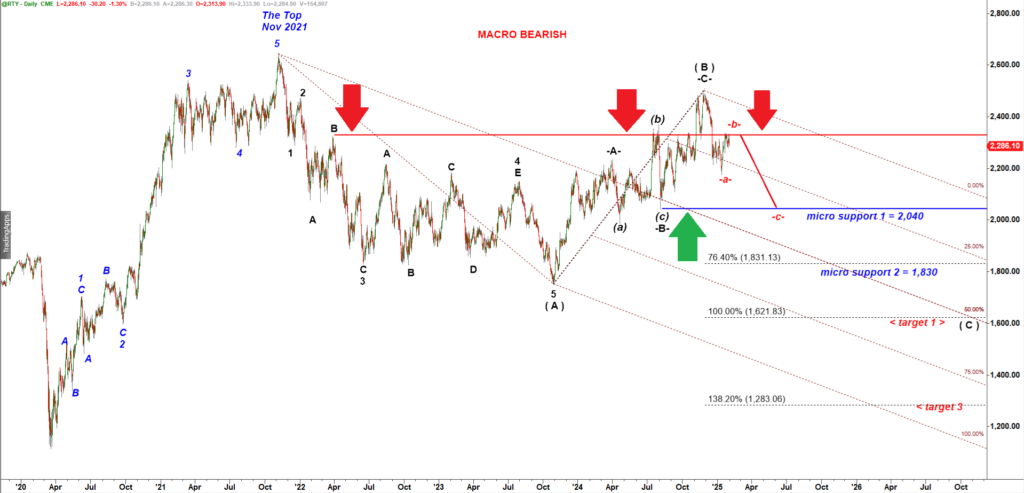
RTY Daily chart
This is where two previous waves B got terminated.
Bears may turn RTY down off that line and push RTY down to the blue trend line.
2,040 level is where the wave -B- down got terminated.
Always remember to pay a lot of attention to any extremes, lows and highs, made by ANY waves b or (b) or B. Those highs and lows are milestones that keep working as very strong support and resistance weeks after they were made. Market almost never is capable of slicing throught those milestone levels without subsequent corrective bounce.