$ES #ES-mini #Elliott Wave #trading setup
Lets look first at a bullish scenario:
$ES dropped down to support of the Green Box:
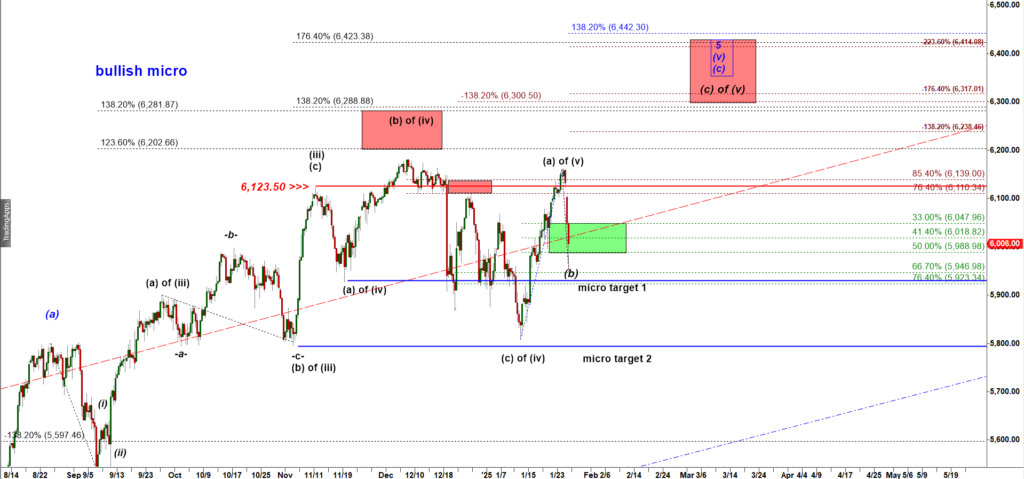
ES-mini 480 min chart
We expected a drop into the Green Box and we got that drop. That wave count allows bulls to start the final leg up in a subwave (c) of wave ( v ) up targeting 6,300+.
But that decline came as a spike panic driven overnight drop. The main problem is that the drop lacked a corrective a-b-c down structure. We always expect any corrective wave (b) or -b- or B to be subdivided into three micro waves a-b-c. The lack of that structure is a warning sign.
Now lets look at the macro bearish “TOP is in” scenario:
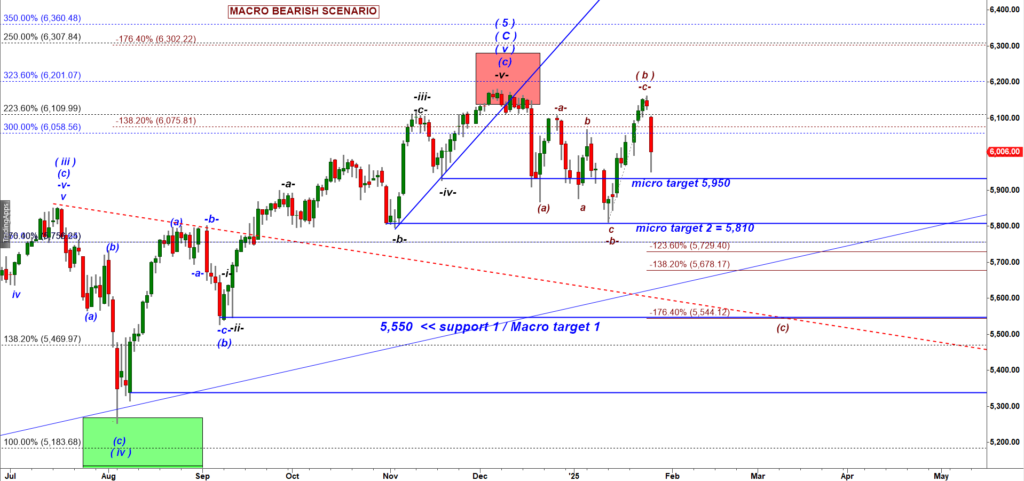
ES-mini Daily chart
You can see the micro support 5,950.
Bears need to push ES under that support to confirm that bearish wave count.
Under that wave count, bears can push ES down in the second wave (c) down to tag / test the MACRO Support / Target 1 = 5,550.