$ES #ES-mini #Elliott Wave #trading setup
ES-480 min chart
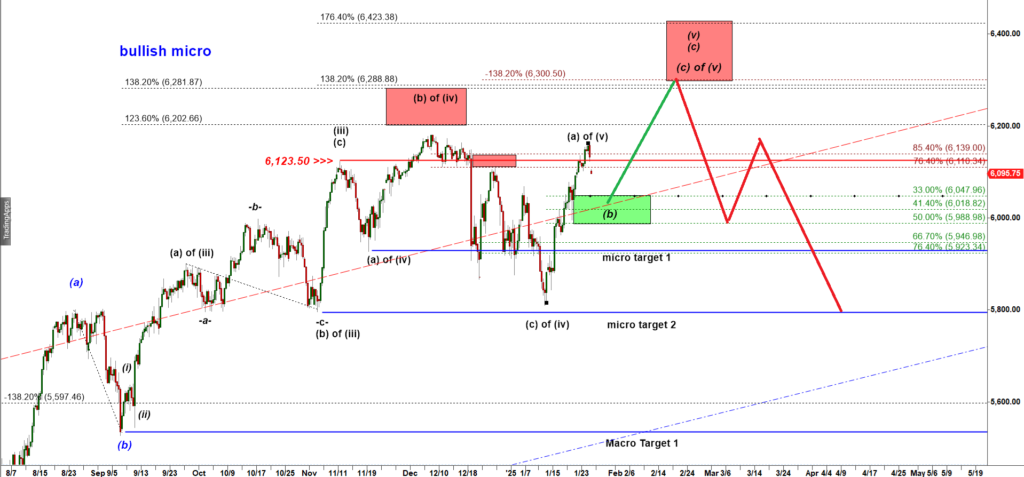
ES mini opened with a gap down diving under the key support 6,123.50.
That drop sets up the textbook ‘failed breakout’ short setup. The subwave (a) up briefly broke above the Nov 24 high at 6,123.50, but bears quickly regained control, pushing the price back below this key resistance level. This initial breakout likely triggered algorithmic activity, driving the price above resistance and forcing retail traders to cover their shorts.
However, as the price dropped back below resistance, bearish momentum intensifies, causing short-sellers to chase the price downward, ultimately leading to a significant decline.
That drop allows bears to push ES down to the Green Box.