$NQ #NQ #trading setup #Elliott Wave #a-b-c bounce
Two paths I will be watching for a corrective a-b-c- up bounce off the Monday low:
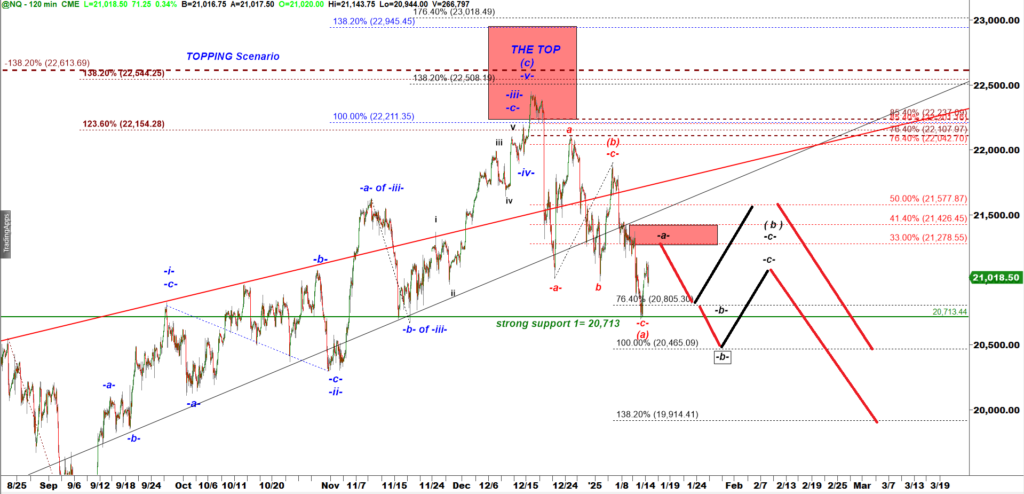
NQ-mini 120 min chart
Watching for Corrective Bounce Scenarios:
Two potential paths to monitor involve a corrective -a-b-c- up bounce from the Monday low. This bounce is expected to be a temporary move within the larger bearish structure.
Primary Bearish Count:
The primary bearish count suggests that after completing the corrective -a-b-c- up bounce, the market is likely to begin another leg down in wave (c). This move would confirm continued bearish momentum in the larger timeframe.
Key Support Level at 20,713:
- The recent decline paused at 20,713, a very strong support level.
- This level is significant because it marks the low of a corrective subwave -b- down formed in mid-November 2024.
- Lows and highs from waves b, (b), or B often act as critical milestone support and resistance levels for weeks or even months.
Market Behavior at Milestone Levels:
Milestone levels like 20,713 serve as strong support zones where price typically experiences a corrective bounce. The market almost never slices through such levels without a retracement or corrective move first.
Strategic Focus:
- Watch for the corrective -a-b-c- up bounce to target potential retracement zones (e.g., 33%, 41.4%, and 50% levels) near 21,278, 21,426, and 21,578, respectively.
- Pay close attention to any retests or breaks of 20,713, as this will provide critical confirmation of either further downside or a potential base forming.