$ES #ES-mini
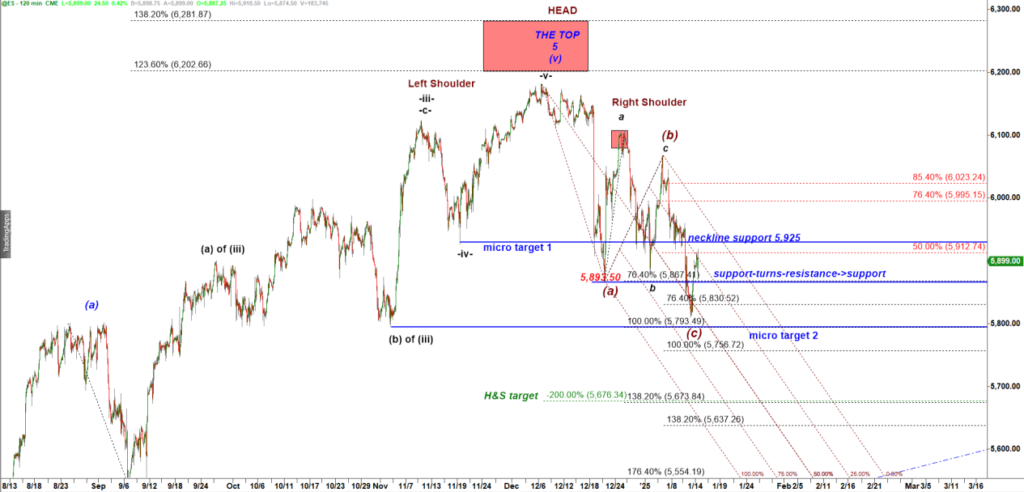
Yesterday Es dropped as expected but did not hit the target 2 = 5,973.50. Then we got a wild full moon day intraday reversal.
Es-mini 120 min chart
 The 5,793.50 level is a very important level of support because that is the critical support that has to be violated to confirm that the five wave up rally off the Aug 2024 low has topped.
$ES #ES-mini
Yesterday Es dropped as expected but did not hit the target 2 = 5,973.50. Then we got a wild full moon day intraday reversal.
Es-mini 120 min chart
The 5,793.50 level is a very important level of support because that is the critical support that has to be violated to confirm that the five wave up rally off the Aug 2024 low has topped.
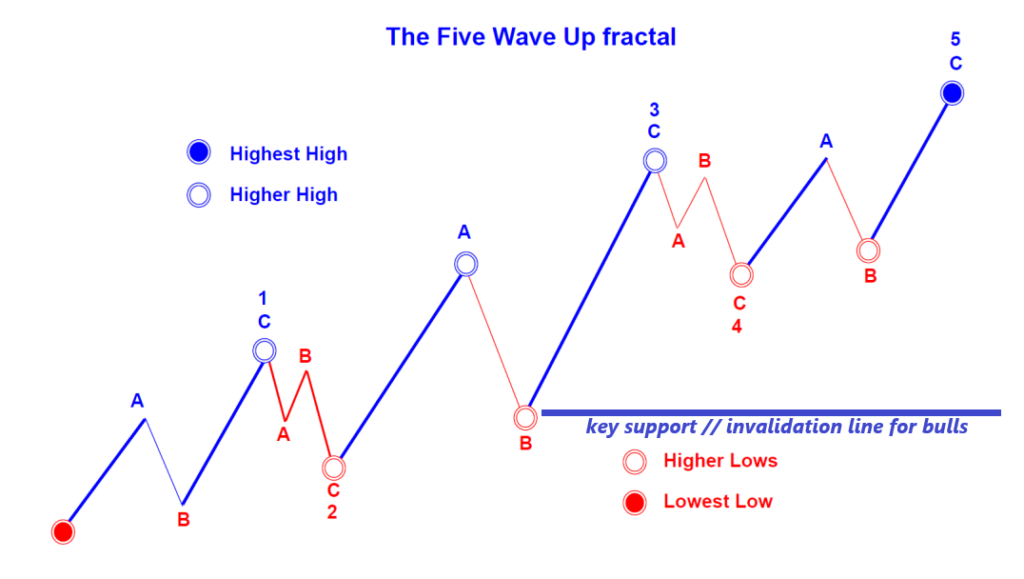
Wave Action and Support Testing:
If a significant support level (e.g., 5,793.50) does not get tested during the primary wave (a) down, it often gets revisited by a subwave -b- down within the corrective wave (b) up. This aligns with the pattern of corrective waves, where bearish momentum can remain strong even during a countertrend pullback.
Bearish Momentum During Corrective Waves:
During corrective structures like -a- up, -b- down, -c- up of wave (b), the bears can still drive prices to lower lows. This highlights the importance of monitoring each phase of the corrective wave for signs of continued bearish strength.
Key Levels to Watch:
- 5,940: This is the 50% retracement of the preceding decline. It is a critical level to watch as a potential resistance.
- 5,925: This remains strong support. Bears need to break below 5,925 to increase the likelihood of testing a lower low. Failure to do so may allow bulls to regain control temporarily.
Resistance Milestones and Extremes:
- The 6,070 level, marked by the subwave -b- up high, is a significant resistance zone.
- Remember: Highs and lows made by waves -b-, (b), or B often become critical support/resistance milestones. These levels tend to hold their importance for weeks after formation, and the market rarely breaks through them without a corrective bounce or retracement.
Strategic Focus:
Pay close attention to wave extremes (both highs and lows) as they guide the market’s subsequent moves. The subsequent corrective wave action around these levels offers opportunities to assess potential reversals, breakouts, or continuation trends.