$SPX #S&P500 #trading setup #Elliott Wave
Bears have a setup to turn NQ-mini down here:
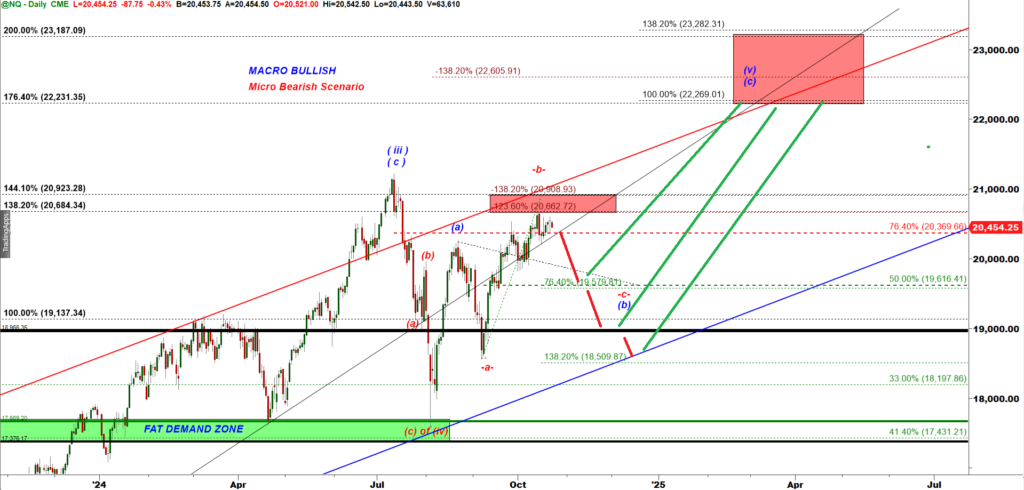
NQ-mini Daily chart
Note that NQ- mini failed to make a higher high in comparison to the July’24 high. That is a sign of weakness. That means NQ would most likely underperform S&P in case the bearish pullback.
This is the bearish wave count for S&P 500 identical to my primary wave count for NQ-mini:
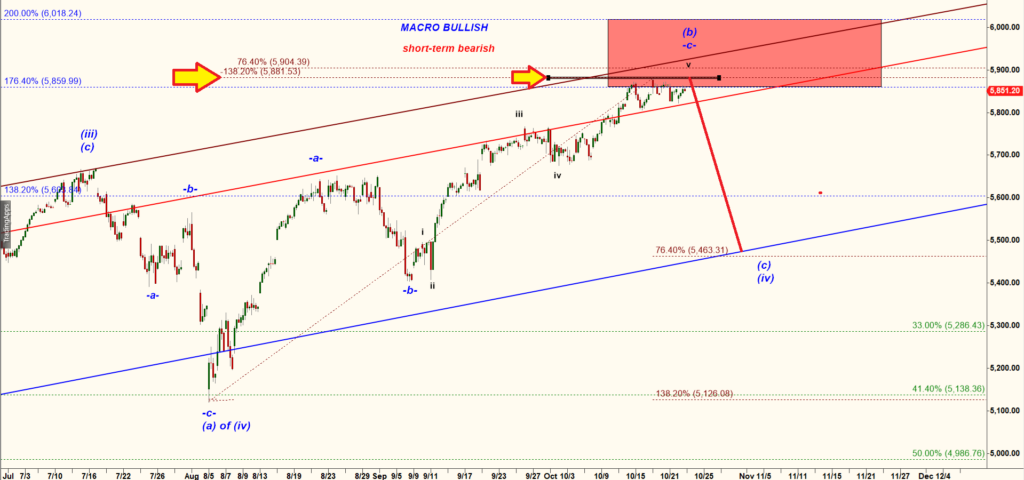
SPX 120 min chart
The key level of resistance, the Rubicon or Maginot line, is 5,881.50. As long as bears hold S&P 500 under that level this short term bearish scenario is very possible. Under that bearish scenario bears can produce a quick panic driven decline down to 5,460
Just like a final stronghold in a battle, this resistance line stands as the crucial level that, if breached, could signal a major shift in market momentum. If bulls manage to break over the 5,881.50 resistance they will be able to trigger a strong and accelerated short covering (panic-driven) rally over 6,100, see the ultra bullish scenario:
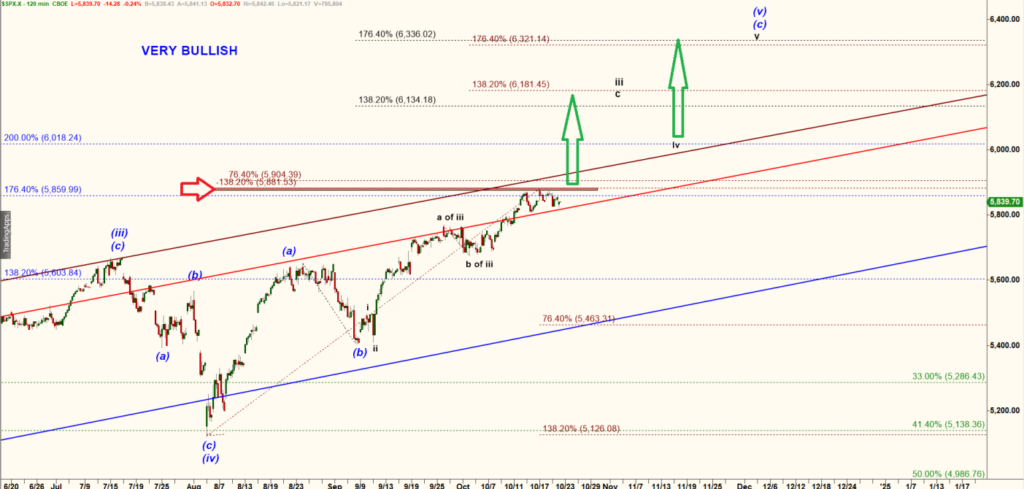
SPX 120 min chart
Here you can listen my podcast explaining why a trader needs to consider several alternative scenarios.