$ES #ES-mini #Elliott Wave #price levels #trading setup
Price tests the 5,871.50 key resistance once again:
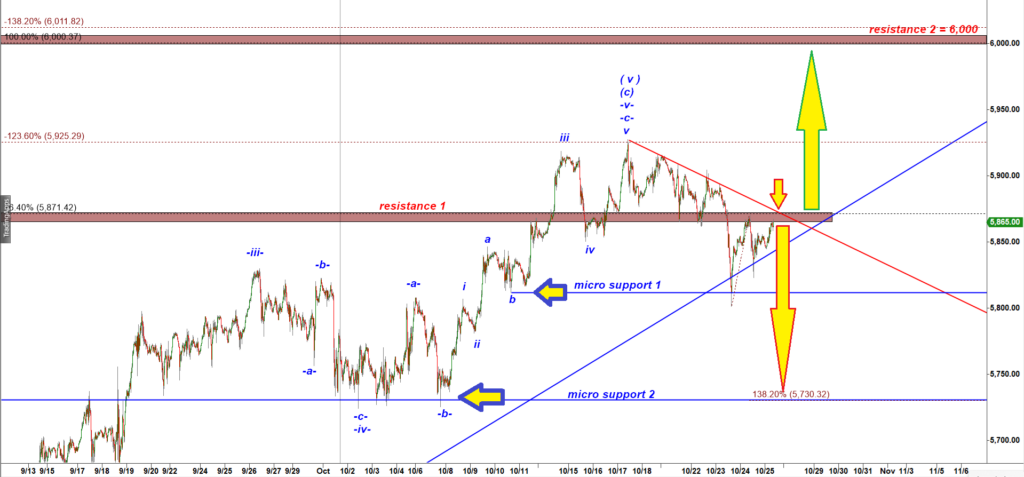
ES-mini 15 min chart
If bulls manage to break over that level bulls will get a decent setup for a rally up to the next strong resistance at 6,000.
If, in contrast, bears manage to defend the resistance 5,871.50 and bulls fail here then we can expect a large leg down to the micro support 2 = 5,730.
That is a great chart to illustrate one useful concept.
Note that I drew two blue lines of two micro support levels from teh low made by two subwaves b.
That is a powerful rule. Lows made by previous pullbacks in subwaves b of any degree create a roadmap for future pullbacks.