$ES #ES-mini #Elliott Wave
I have been tracking two scenarios and both allow bulls to push ES-mini to 6,000.
Let’s start from a bullish scenario:
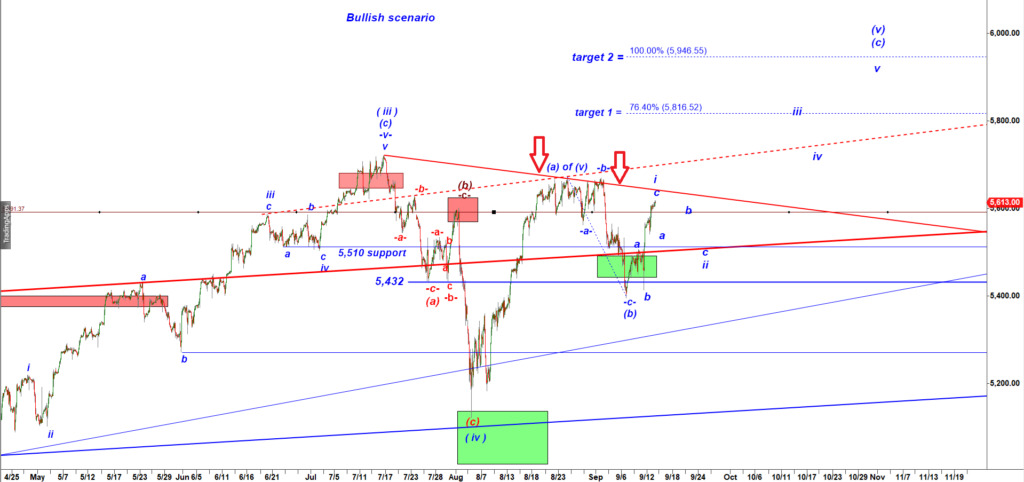
ES-mini Daily chart
That bullish wave count argues that the final leg up in a subwave (c) of wave (v) up has already started. In majority of cases the subwave (c) of wave (v) up has a clean five wave up microstructure. So I would be counting that rally as a micro wave i up that should be followed by a pullback or consolidation in a micro wave ii down.
(2) Micro Bearish scenario:
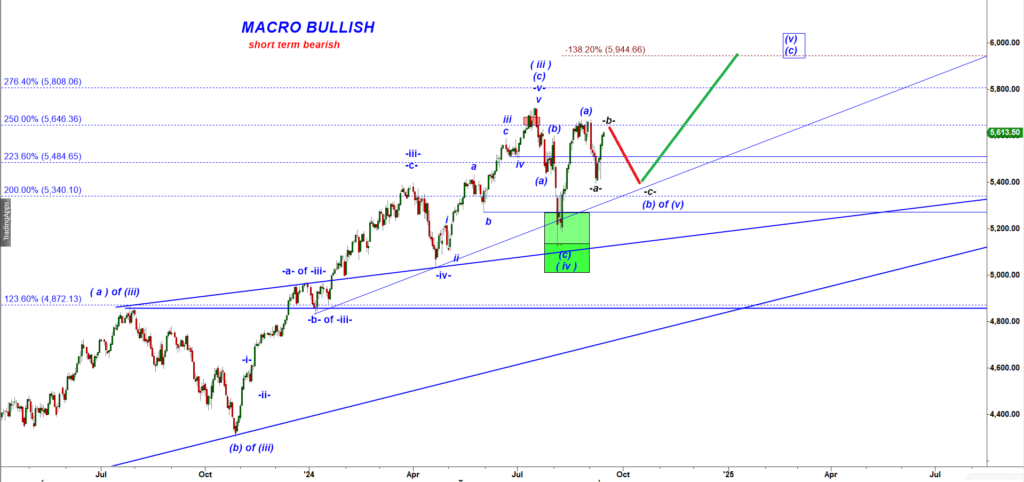
ES-mini Daily chart
More often than not a subwave (b) down of wave (v) up has a clean a- down, b up, c down subdivision. To complete that a-b-c down structure bears can push ES-mini down one more time.
So it all depends on what kind of a pullback we get after this rally tops out. If we get a corrective a-b-c down move that would confirm the bullish scenario. In contrast, a sharp drop would confirm the bearish scenario. But again, under both scenarios the next pullback should create an attractive long setup to ride a breakout to a new all time high.