$ES #ES-mini #Elliott Wave #trading setup
I keep tracking two scenarios / paths leading ES up to 6,000.
The first scenario is a short term bearish scenario:
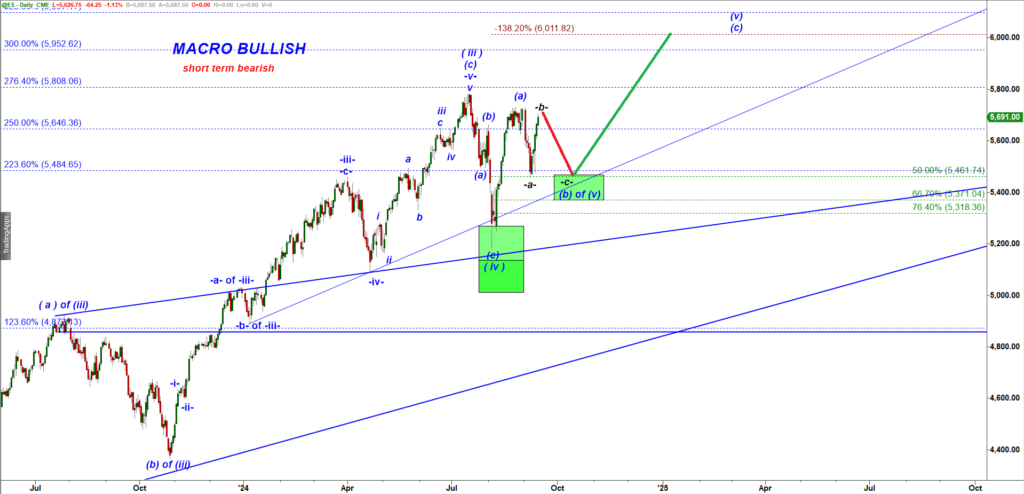
ES-mini Daily chart
The short term bearish scenario considers the rally we got last week as a corrective subwave -b- up to be followed by a sharp decline in a subwave -c- down back down to the Green Box.
(2) the short term bullish scenario:
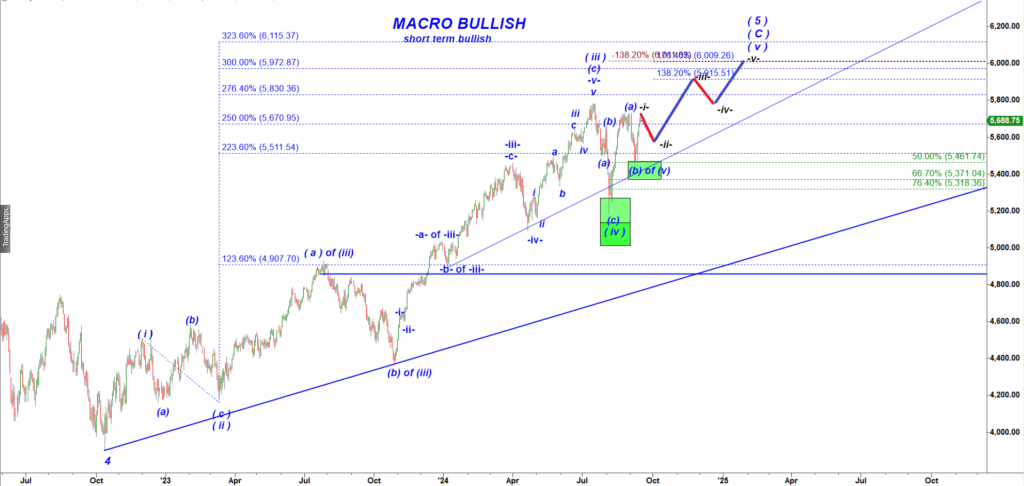
ES-mini Daily
I think macro wise ES mini is very late in the bullish cycle. The upside is very limited. We can get a push up to 6,000- 6,100 but this is where the market may make a multi year top.
The bullish wave count / scenario considers the rally we got last weak as a micro wave i up that should be followed by a micro pullback in a micro wave ii down:
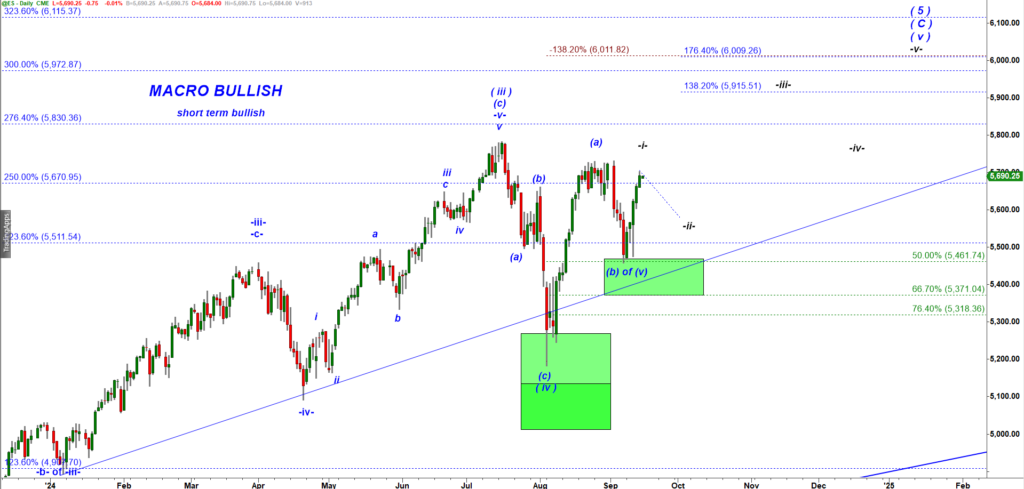
ES-mini Daily chart
So it all depends on what kind of a pullback we get after this rally tops out. If we get a corrective a-b-c down move making a higher low that would confirm the short term bullish scenario.
In contrast, a sharp drop would confirm the short term bearish scenario. But again, under both scenarios the next pullback should create an attractive long setup to ride a breakout to a new all time high.