$SPX $S&P 500 #trading #fractal analysis
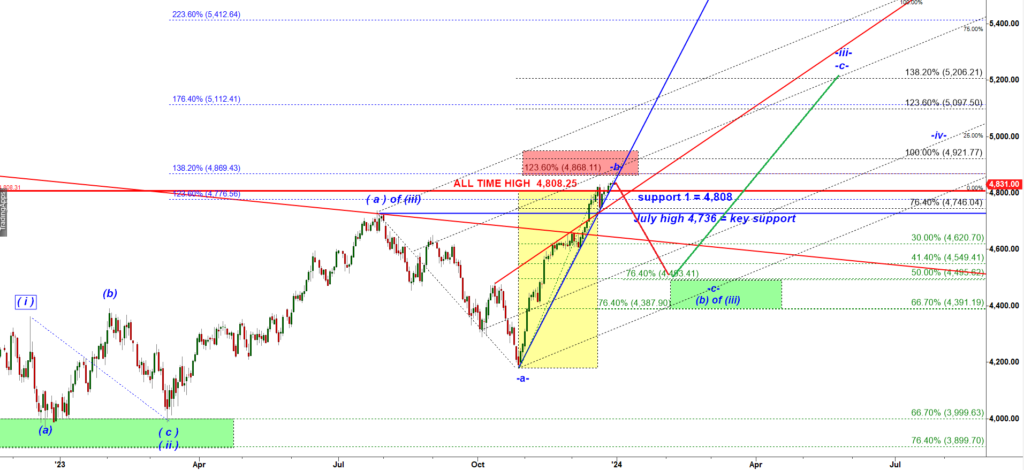
This is my macro forecast for the first half of 2024:
I found a very similar fractal that may be in play:
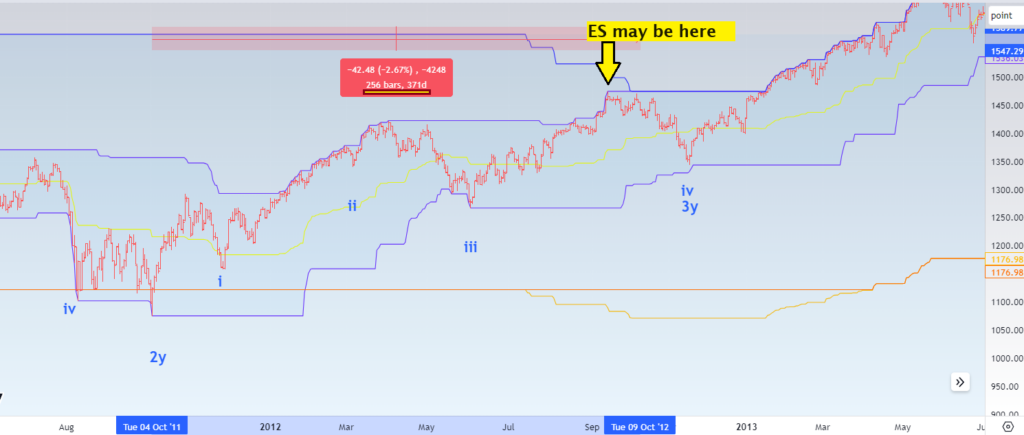
Look at the structure of the rally off the October 2011. Note in 2012 year S&P topped 256 trading days after the Oct 2011 low.
Now let’s look at the structure of the rally off the Oct’2022 low:
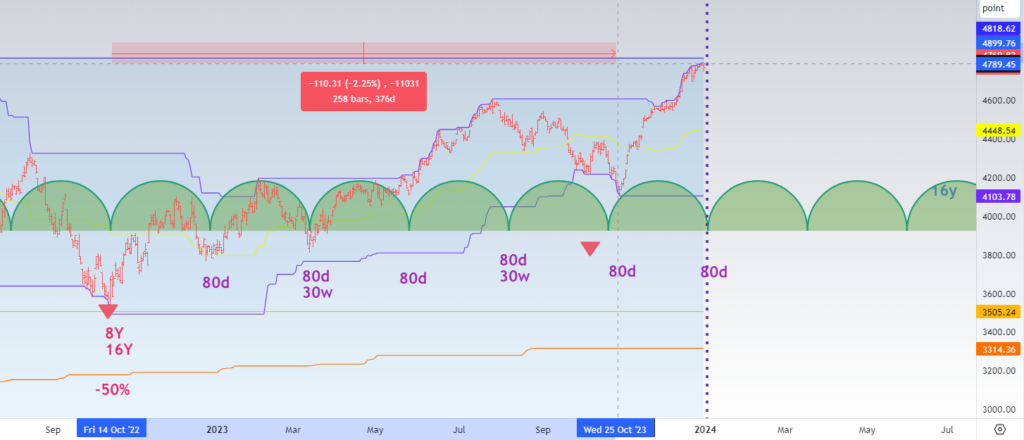
Interestingly, SPX closed the 2023 year at the high standing 258 trading days past the Oct’22 low.
According to that fractal, S&P can decline making a fresh 80 day lower low.
The pullback in 2012 retraced 66.6% of the rally price wise and took 61.8% of time consumed by the preceding leg up. If SPX follows the same ratios we can get a pullback down to 4,341 into early Feb’24.
However, I will be watching a 50% retracement in price currently standing at 4,460. That would be a very attractive entry point for long positions to ride the next strong leg up.
Please note S&P has only been up 47% of times in January over the last 15 years, and that’s the lowest odds of every other month of the year.