$ES #ES #trading setup #Elliott Wave #breakdown #Gann
Under the bullish scenario bulls still have a chance to stop this decline at the lower edge of the Green Box, turn ES back up and produce the second leg up in a wave (c) up targeting the Red Box:
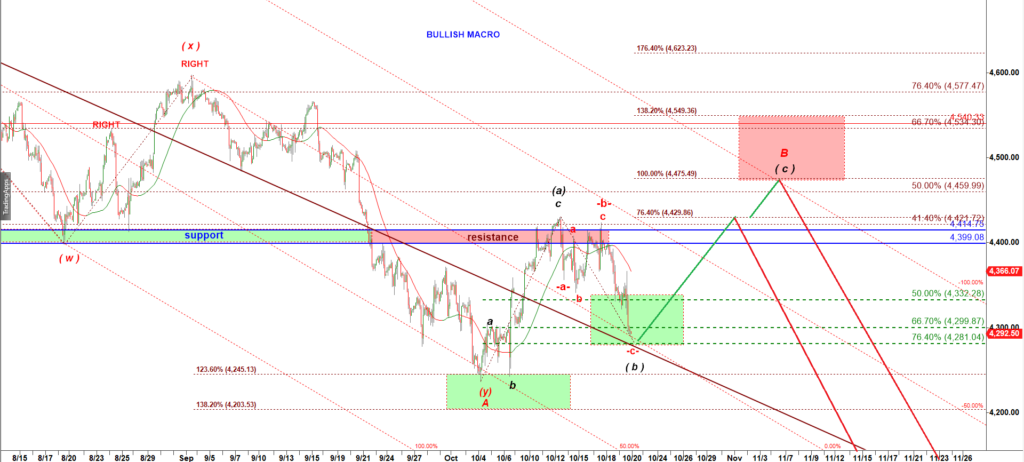
In 90% of cases a corrective bounce follows that (a) up, (b) down, (c) up path.
This is the main assumption behind the bullish scenario.
However, once in a while we get a bounce shaped almost like a straight line.
In that case we consider that rally a failed attempt to start a five wave up structure and count that corrective wave X up.
If the October rally was that rare move in a wave X up, then this decline is just a beginning of a very big (a)-(b)-(c) down or (w-(x)-(y) down structure:
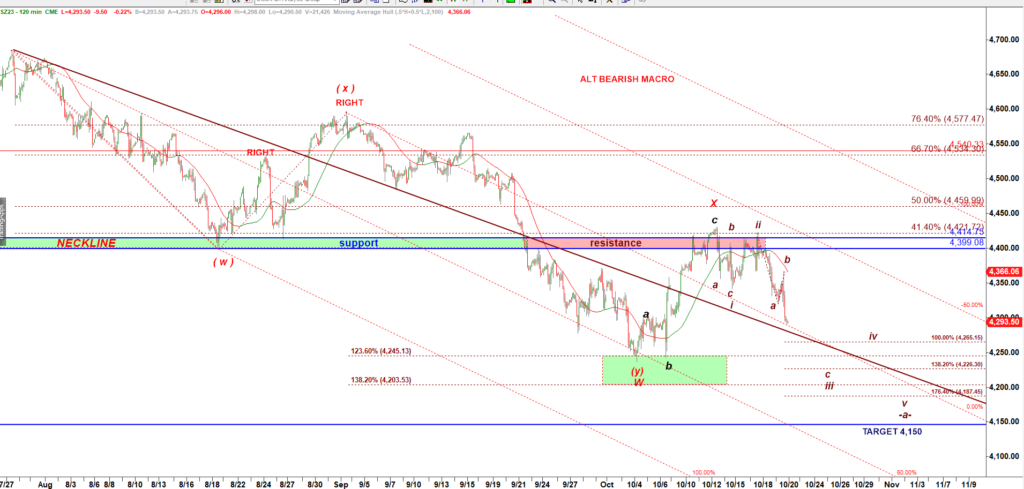
This is a very bearish breakdown scenario. Under that scenario, this decline can stretch overnight down to 4,265. Then after a small bounce it can extend down to 4,226
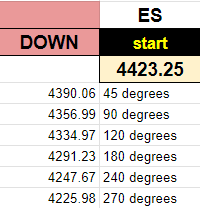
However, so far bulls have been holding ES at a strong Gann’s level of support at 4,291:
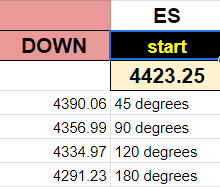
However, if bears managed to break under 4,291 support the next strong support would be 4,226:
If this decline is subwave c of wave iii down it should keep dropping the whole night and we shoudl open on Friday with a gap down with 4,265 level having been tested overnight.
If we do not get that strong decline overnight that would be a strong argument against that very bearish scenario.
Again, the first bullish scenario is based on assumption that this pullback will continue to unfold in the normal way and follow a repeating pattern.