S&P 500: MACRO UPDATE: A Pullback Making a Higher Low Would Confirm a Reversal

  • CastAwayTrader
  • October 8, 2023
<<< Back to All Updates
<<< Macro Updates

$SPX #S&P500 #macro #weekly #weekend

In this weekend update I will be updating scenarios we discussed in details the previous Sunday (Part I: The Bearish Macro and Part II: The Bullish Macro).

Last week S&P hit the upper edge of the Green Box and we got an immediate bullish reaction.

SPX Daily chart

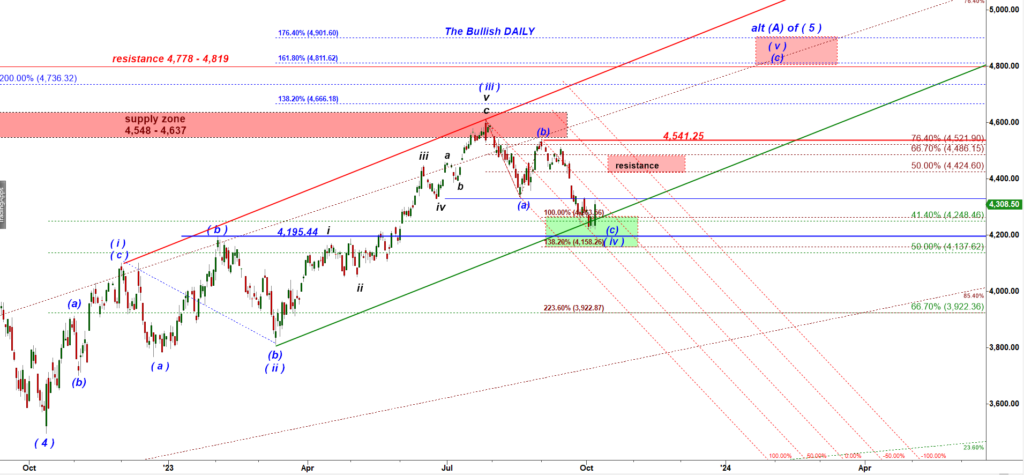
Bulls consider the (a)- (b) – (c) down move off the July high as a corrective wave (iv) down.

Bulls believe that (a)-(b)-(c) move down was just a temporary pause in the ongoing five wave up rally and they felt scared of missing out opportunity to go loong on Friday because that move up off teh support could be a start of a new rally in a wave (v) up.

Under that bullish macro scenario / wave count the corrective pullback in wave (iv) down should be followed by a strong impulsive rally in a subwave (a) of wave ( v ) up targeting the high made by the wave (iii ) up in July 2023 (4,607 for SPX and 4,684 for ES-mini).

The Bearish macro argues the July’23 high was the top of a large corrective wave B up and the (a)-(b)-(c) decline was a micro wave (i) down of a new large five wave down move in a wave C down. If that decline is a wave (i) down it should be followed by a corrective (a)-(b)-(c) up pullback in a wave (ii) up that should make a lower high UNDER the July high:

SPX Weekly chart

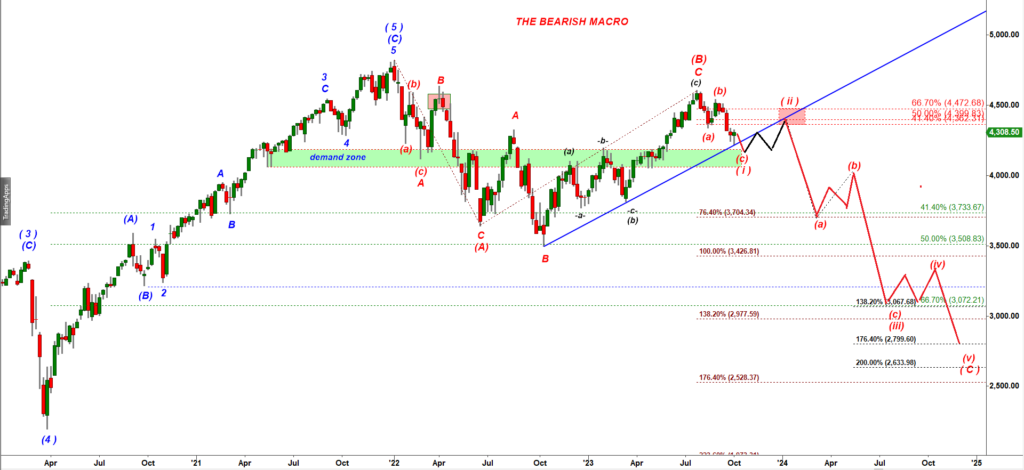
To confirm that we deal with the Bearish macro scenario bears need to push S&P down one more time to hit that green demand zone on the weekly chart above.

This is how that bearish micro path can look like:

SPX 120 min chart

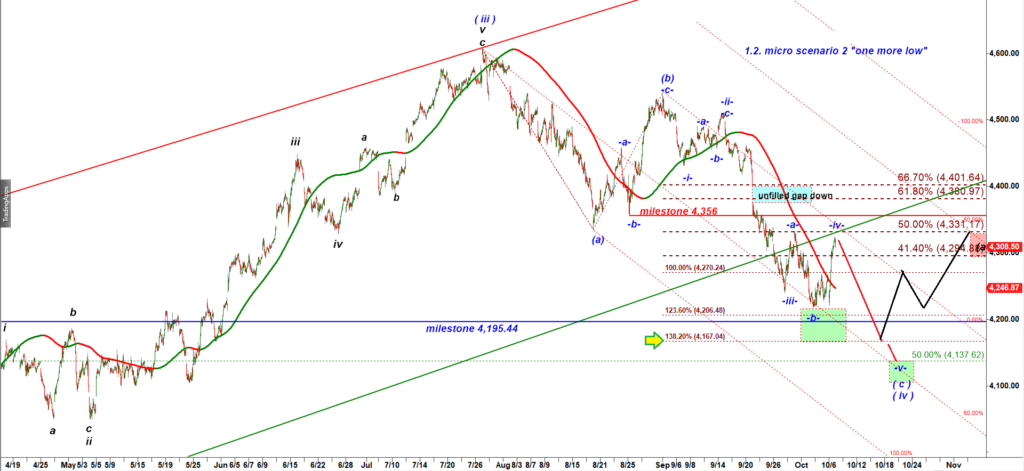
That bearish micro scenario considers the Friday rally as a subwave-c- in a corrective -a- up, — down, -c- up structure of the wave -iv- up. That scenario allows bears to make one more push lower down to the 138.2% ext of the wave ( a ) = 4,167 (SPX cash index).

One more push down would confirm that we deal with the MACRO BEARISH scenario because it would make the (a)-(b)-(c) move down off the July high a way too big for a corrective wave (iv) down.

However, the market likes to keep opened all the paths as long as possible.

Therefore it may try to keep that uncertainty not allowing bears to make one more push lower.

What I mean is that we can be following the micro 1.1. scenario that would keep alive both the Macro Bullish and the Macro Bearish Paths alive:

SPX 120 min chart

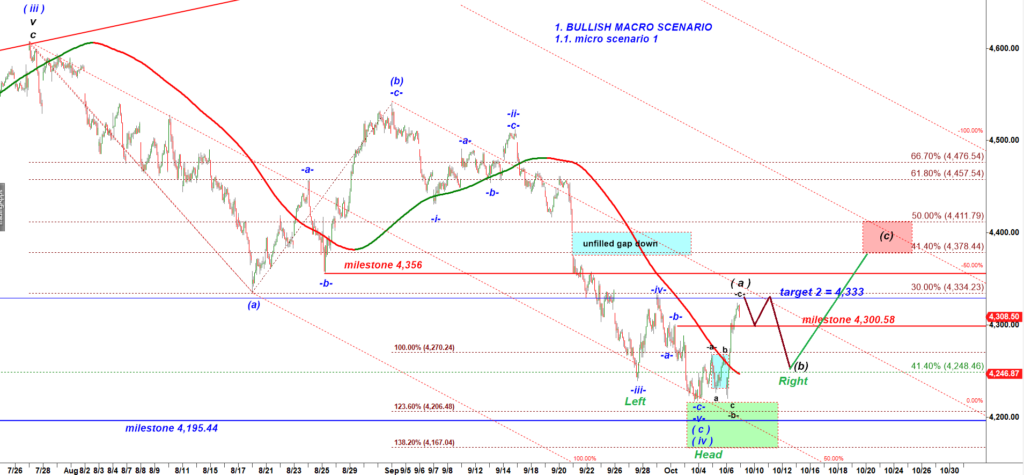
We can call that micro bullish scenario the primary one. The a-b-c move up we got off the last low (could op on Monday or can make a slightly higher high on Sunday night or on Monday morning) can be counted as a wave ( a ) up that should be followed by a corrective wave (b) down.

Note that a corrective pullback in a wave (b) down would complete our favorite reliable bullish reversal setup, the Inverse Head and Shoulders setup.

Let’s come back to the Macro Bullish scenario:

SPX Daily chart

If bulls manage to defend the lows made last week and keep pushing S&P higher the moment of truth will happen when price hits the lower red box “resistance”.

In conclusion:

(1) the Friday rally did not invalidate the micro bearish scenario that allows bears to push lower one more time to complete the (a)-(b)-(c) move down off the July high. See potential bearish micro scenario 1.2 shown above.

(2) the Friday rally stopped right under a very strong resistance 4,333 for SPX cash index.

(3) Even if the (a)-(b)-(c) move down off the July’23 top bottomed last week I would expect an a-b-c down pullback this coming week. A corrective a-b-c move down to a higher low would complete a bullish reversal setup based on the Inverse Head and Shoulders pattern, a reliable money maker.

Subscribe to Free Updates

Get Unlimited Access

PrevPrevious$ES: We Got A Crazy Short Covering Rally. Do not Get bullish!
Next$ES: Both Micro Scenarios Argue for A Move LowerNext

More To Explore

$ES: The Market Ignores Bearish Sentiment

#ES #Elliott Wave Despite broad bearish sentiment, ES continues its slow grind upward. S&P Cash Index 15 min chart 🟢

CastAwayTrader June 30, 2025

$GC: Gold Has a Bullish Setup

#GC #long setup This bullish macro wave count of Gold that considers that drop as a subwave B down of

CastAwayTrader June 30, 2025

Important Disclaimer

CastAway Trader LLC, the publisher of this web-site and videos is not registered as an investment adviser nor a broker/dealer with either the U. S. Securities & Exchange Commission or any state securities regulatory authority. Users of the website www.castawaytrader.com and viewers of the videos are advised that all information presented on the website is solely for informational purposes, is not intended to be used as a personalized investment recommendation, and is not attuned to any specific portfolio or to any user’s particular investment needs or objectives.

Trading stocks, options, or futures carries a high level of risk, and may not be suitable for all investors. Before deciding to trade, you should carefully consider your objectives, financial situation, needs and level of experience. CastAway Trader LLC provides general overview of trading methods that does not take into account your objectives, financial situation or needs. The content of this website must not be construed as personal advice. All trading setups and/or trades presented in the web site and/or trading chat room by CastAway Trader an/or by other members of the chat should be considered hypothetical for educational purposes only and should not be expected to be replicated in a live trading account.

An investor could potentially lose all or more than the initial investment. You should not speculate with capital that you cannot afford to lose. Only risk capital should be used for trading and only those with sufficient risk capital should consider trading. Risk capital is money that can be lost without jeopardizing ones’ financial security or life style.

You should be aware of all the risks associated with trading. You should seek advice from an independent financial advisor.

Any information posted on this web site is not to be construed as an offer to sell or the solicitation of an offer to buy, nor is it to be construed as a recommendation to buy, hold or sell (short or otherwise) any security. All users of the website must determine for themselves what specific investments to make or not make and are urged to consult with their own independent financial advisors with respect to any investment decision. The reader bears responsibility for his/her own investment research and decisions, should seek the advice of a qualified securities professional before making any investment, and investigate and fully understand any and all risks before investing. All opinions, analyses and information posted on the website are based on sources believed to be reliable and written in good faith, but should be independently verified, and no representation or warranty of any kind, express or implied, is made, including but not limited to any representation or warranty concerning accuracy, completeness, correctness, timeliness or appropriateness. In addition, CastAwayTrader LLC and its officers and employees undertake no responsibility to notify such opinions, analyses or information or to keep such opinions, analyses or information current. Also be aware that the owners, officers and employees of the web site www.castawaytrader.com may have long or short positions in securities that may be discussed on the website, Premium Trading Chat room and/or in the videos posted by CastAway Trader LLC.

Past results are not indicative of future profits.

Subscribe to Free Updates

Get Unlimited Access